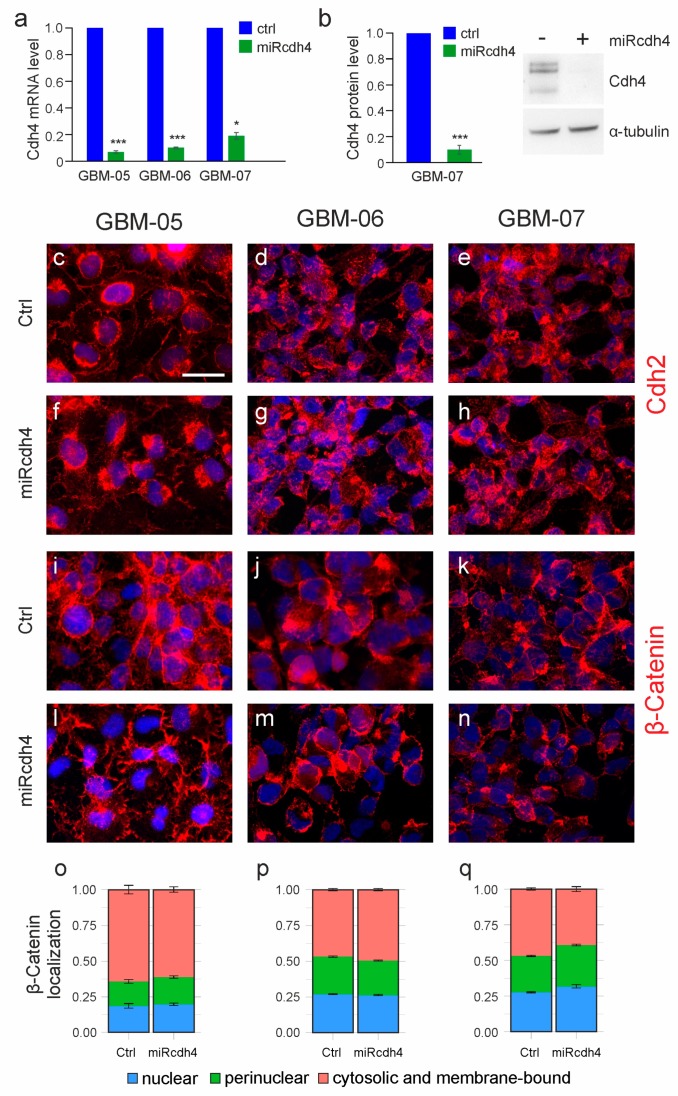
Figure 3.
Effect of the miRcdh4 transduction in GICs. (a,b) Quantification of Cdh4 mRNA expression by quantitative PCR (a) or protein expression by western blot (b) of Cdh4 silenced GICs compared to control transduced GIC cultures. (c–n) Representative immunofluorescence stainings with anti-Cdh2 (c–h) or anti-β-catenin (i–n) antibodies of different Cdh4 silenced or control transduced human GIC cultures. Nuclei are showed in blue using Hoechst. Scale bar: 25 µm. (o–q) Subcellular localization of β-catenin immunoreactivity in the different GIC cultures upon miRcdh4 or control transduction, assessed by image analysis. Values are reported as fraction of total β-catenin signal. * p < 0.05, *** p < 0.001.

