Figure 3.
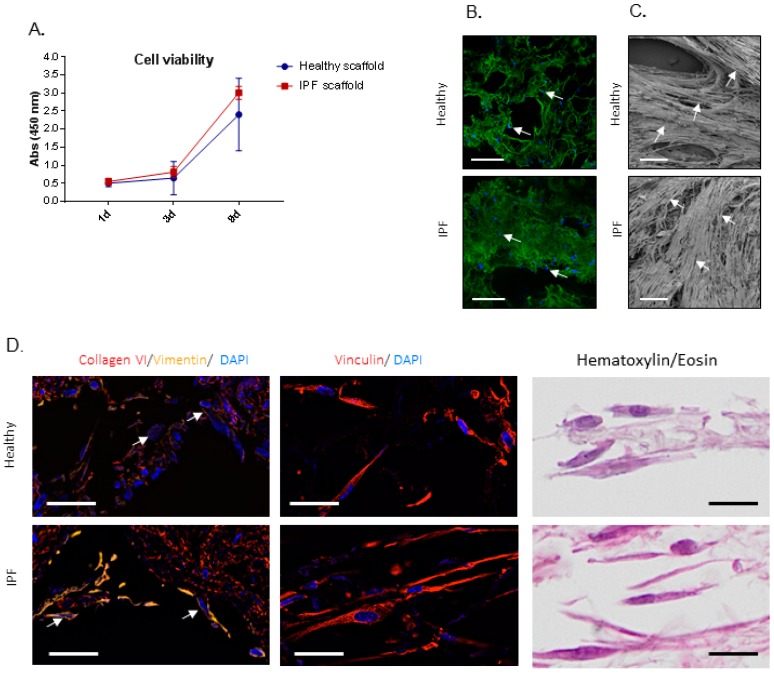
Cell viability and cell attachment of repopulated IPF and healthy tissue scaffolds. (A) Cellular viability of primary lung fibroblast repopulated on tissue scaffolds (biological replicates n = 4), shown as mean ± SD. (B) Confocal live imaging after 1 day of culture, showing equal cell attachment. Cell staining (blue), autofluorescent scaffold (green). Arrows indicate cells. Scale bar = 500 µm. (C) SEM after 9 days of culture, visualizing cellular differences in orientation in the scaffolds and repopulation. Arrows indicate elongated cells. Scale bar = 100 µm. (D) Visualization of repopulated scaffolds, showing fibroblasts attaching to the surrounding tissue (here: collagen type VI) and cytoskeleton (vimentin) and patterns of focal adhesions (vinculin). Hematoxylin/eosin staining of corresponding scaffolds shown in the right panel. Arrows: different intensities of vimentin in fibroblasts repopulating healthy vs. IPF scaffolds. Scale bar = 20 µm.

