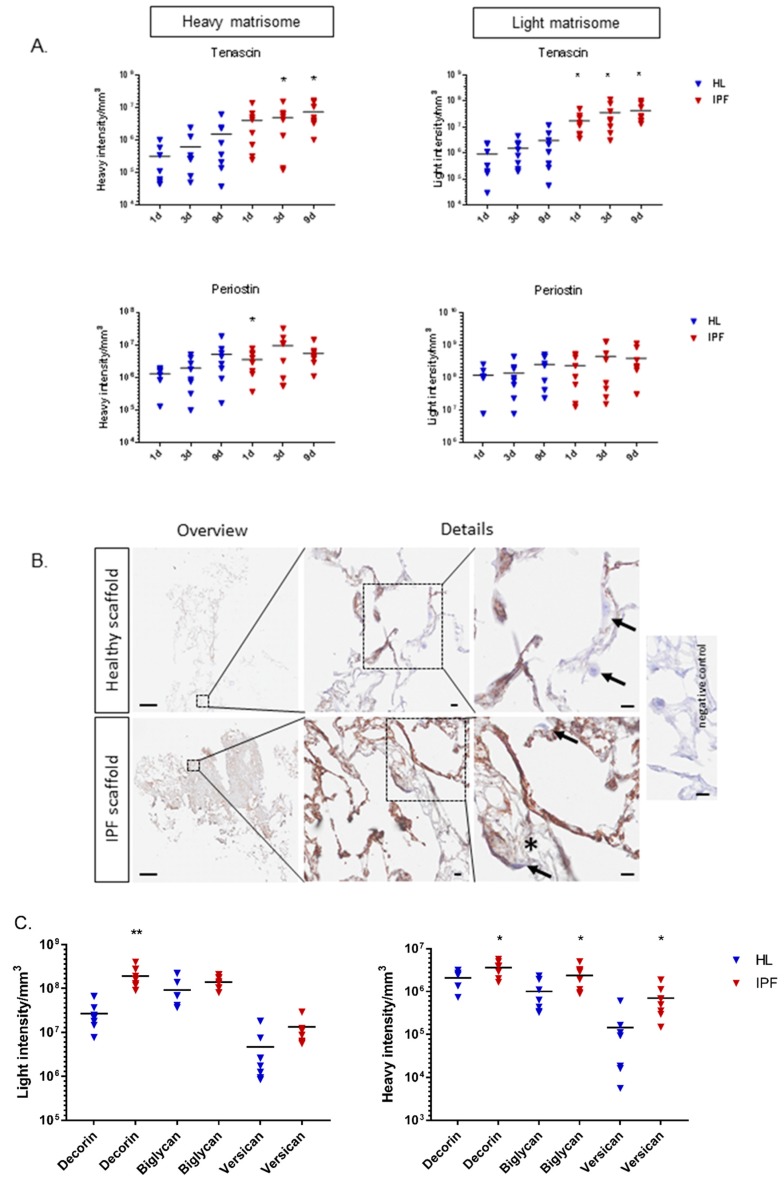
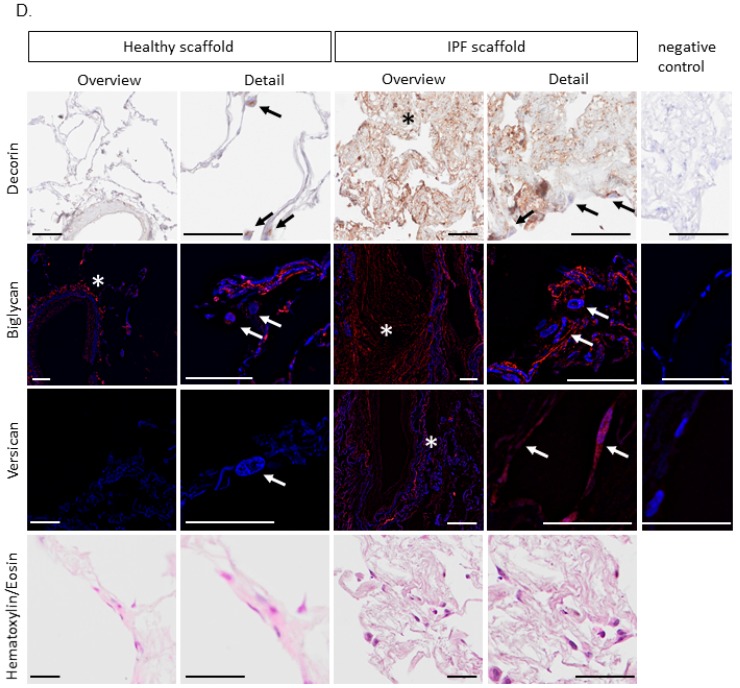
Figure 6.
(A) Graphs of heavy and light intensity/mm3 of tenascin and periostin of repopulated scaffolds (biological replicates n = 4, technical replicates n = 2) with calculated grand mean. Student’s t-test for significance between patient groups means for each time point (* p < 0.05). (B) Periostin in repopulated scaffolds (day 1). Antibody labeling indicating periostin (brown) in certain areas in alveolar septa in the healthy scaffolds, and to a stronger degree in less remodeled tissue areas in the IPF scaffolds. Largely absent periostin staining in heavily remodeled IPF tissue areas (*). Arrows highlight differences in intracellular staining. Scale bar overview 500 µm, details 10 µm. (C) Graphs of original (light) and newly synthesized (heavy) proteoglycans decorin, biglycan, and versican of repopulated scaffolds (biological replicates n = 4, technical replicates n = 2) are presented with calculated grand mean of light and heavy intensity at day 1. Student’s t-test for significance between patient groups (* p < 0.05, ** p < 0.01). (D) Antibody staining illustrating proteoglycan increase in IPF vs. healthy scaffolds (day 1) of newly synthesized proteoglycans including original scaffold composition. Decorin (brown): IPF scaffold showing intrinsically more decorin, with cellular signal in fibroblasts on both scaffold types. Biglycan (red): rare intrinsic biglycan in healthy scaffolds apart from vessels, but strong accumulation in IPF scaffolds. Cellular signal of biglycan in fibroblasts on both scaffold types were seen. Versican (red): absent intrinsic versican in healthy scaffolds, but distinct accumulation in IPF scaffolds. Prominent cellular signal in fibroblasts on IPF scaffolds, but not on healthy scaffolds. * extracellular deposition in repopulated scaffolds. Arrows highlight differences in intracellular staining. Corresponding hematoxylin/eosin staining of the repopulated scaffolds shown in bottom row. Scale bar 50 µm.


