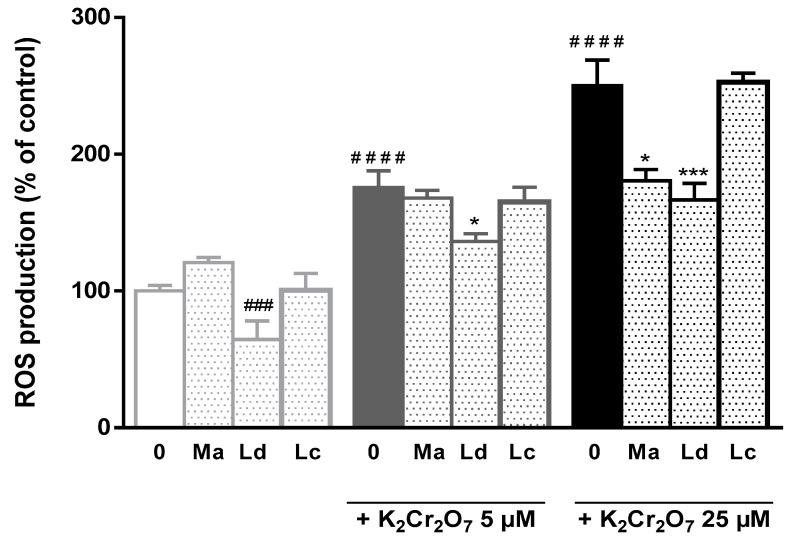
Figure 2.
Effect of M. aquatica, L. dentata and L. cardiaca hydroethanolic extracts (at 50 µg/mL) in ROS production in HepG2 cells in the absence or presence of 5 or 25 μM of potassium dichromate. Values are expressed as means ± S.D. of percentage of ROS production with respect to the control (untreated cells). K2Cr2O7, potassium dichromate; Ma, M. aquatica extract; Ld, L. dentata extract; Lc, L. cardiaca extract.

