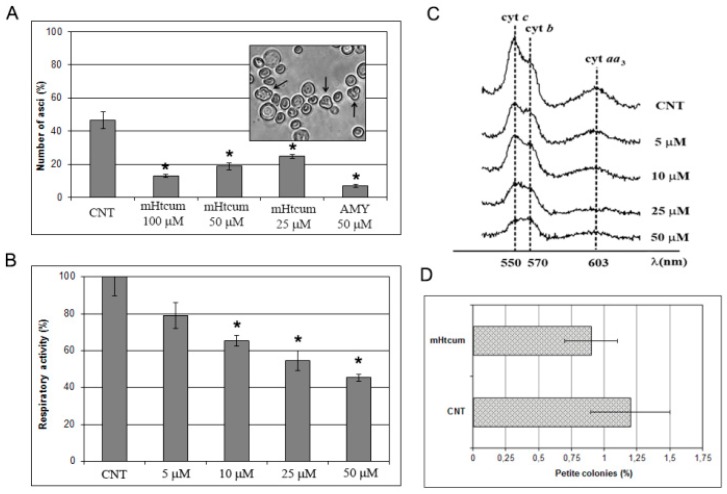
Figure 3.
Interference of mHtcum on mitochondrial activity in S. cerevisiae. (A) Asci production in W303 diploid strain treated with mHtcum. The effect of thiosemicarbazone was compared with the effect of the mitochondrial respiratory inhibitor antimycin A (AMY). Values are expressed as percentage of asci with respect to the number of total cells; statistically significant differences from the control (CNT) were indicated with an asterisk (p ≤ 0.05). (B) Oxygen consumption rate. W303-1B grown in the absence (CNT) or in the presence of mHtcum at different concentrations (from 5 to 50 µM). Values were normalized to the untreated strain and represented as the mean of at least three values ± SD. Values significantly different from CNT were indicated with an asterisk (p ≤ 0.05). (C) Reduced versus oxidized cytochrome spectra: peaks at 550, 560 and 602 nm correspond to cytochromes c, b and aa3, respectively. The height of each peak relative to the baseline is an index of cytochrome content. (D) Mitochondrial DNA mutability. Frequency of respiratory deficient (petite) cells determined in untreated (CNT) or 50 μM mHtcum treated yeast cultures, expressed as a percentage.

