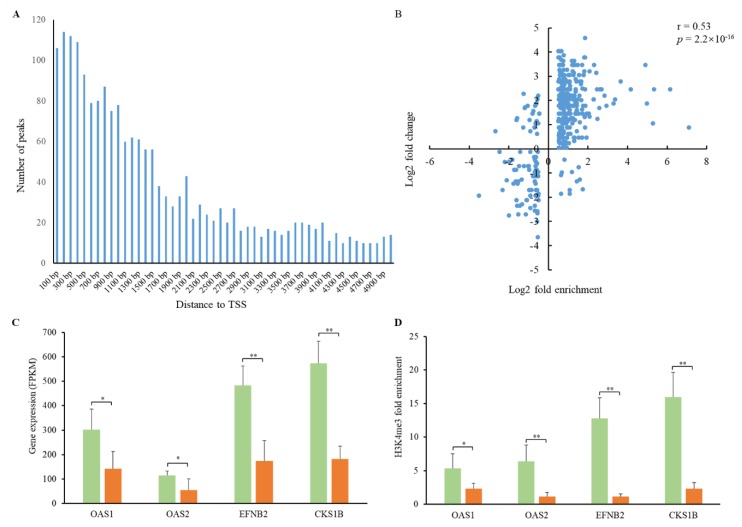
Figure 5.
H3K4me3 peak distribution and associations with gene expression. (A) Distribution of H3K4me3 peaks with the distance to the transcription start site (TTS). (B) Associations between H3K4me3 enrichment and gene expression. Pearson’s coefficient r = 0.53, p = 2.2 × 10⁻¹⁶. (C) Expression of the OAS1, OAS2, EFNB2, and CKS1B genes in PEDV-infected and control samples. (D) H3K4me3 fold enrichment of the OAS1, OAS2, EFNB2, and CKS1B genes in PEDV-infected and control samples. Green and oranges bars represent PEDV-infected and control samples, respectively. * p < 0.05, ** p < 0.01.

