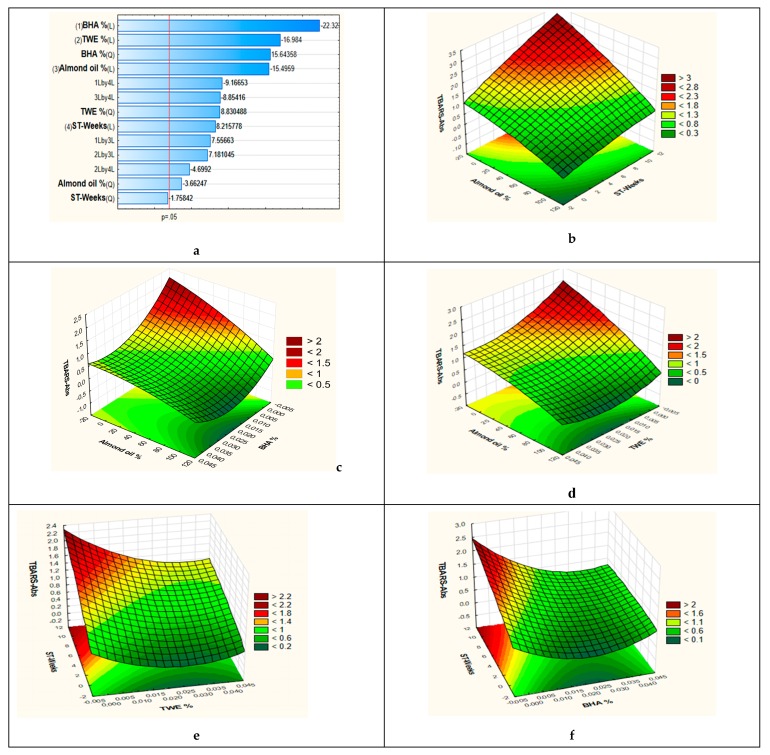
Figure 4.
(a): Pareto chart showing the effects of the significant model coefficients. (b): Response surface plot showing the combined effect of storage time and emulsion almond oil %. (c): Response surface plot showing the combined effect of BHA concentration and emulsion almond oil %. (d): Response surface plot showing the combined effect of thyme extract concentration and emulsion almond oil %. (e): Response surface plot showing the combined effect of thyme extract concentration and storage time.(f): Response surface plot showing the combined effect of BHA concentration and storage time. TWE: Thyme waste extract; ST: storage time.

