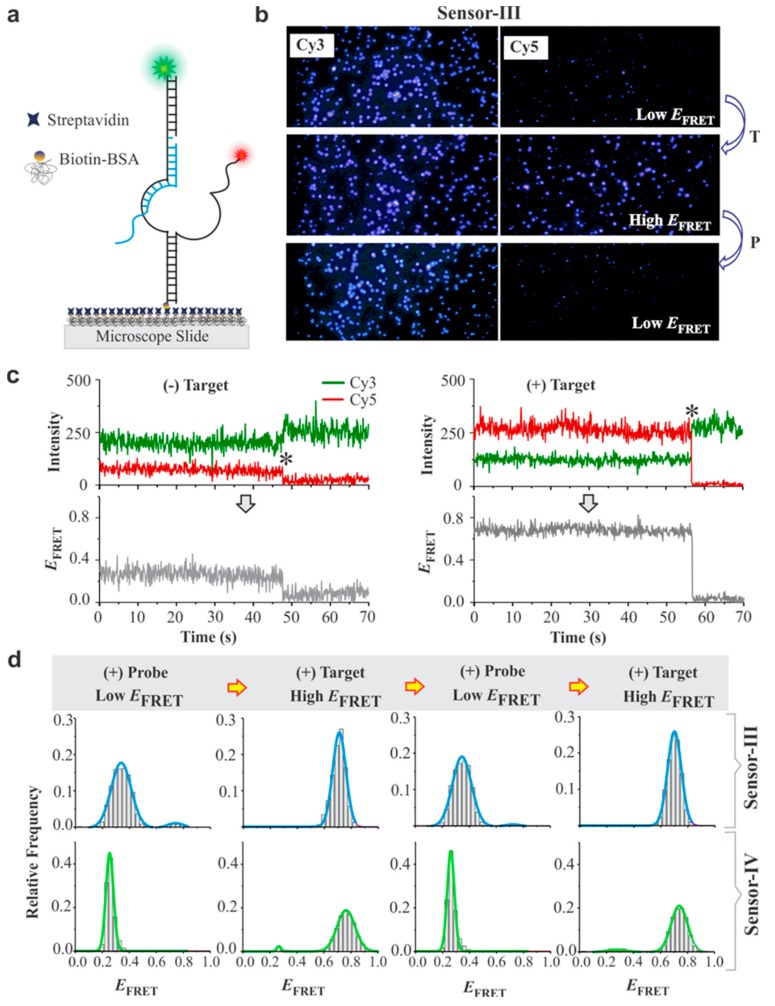
Figure 3.
Single molecule analysis of DNA sensors. (a) Experimental setup for the prism-based total internal reflection fluorescence (pTIRF) microscopy analysis of sensors. The quartz slide was coated with biotin bovine serum albumin (bBSA) and then streptavidin. The sensor molecules were immobilized on the slide via biotin–streptavidin interaction. (b) Fluorescence images of surface-immobilized sensor-III before (top) and after addition of target DNA (middle). The image of the same microscope slide after addition of probe (bottom). (c) Typical single molecule traces of sensor-III. Left: open conformation (low-EFRET state); right: closed conformation (high-EFRET state). Top panels display fluorescence intensities of the donor (Cy3: green) and the accepter (Cy5: red) fluorophore and the bottom panel depicts FRET efficiencies calculated from the corresponding intensity–time traces. The asterisks indicate the photobleaching events of Cy5 fluorophores. (d) single-molecule FRET (smFRET) histograms of sensors III and IV each switching between the low- and the high-EFRET conformations after alternate addition of an excess (1 μM) probe (P) and target (T). Each EFRET histogram was prepared from 95–110 molecules.

