Figure 4.
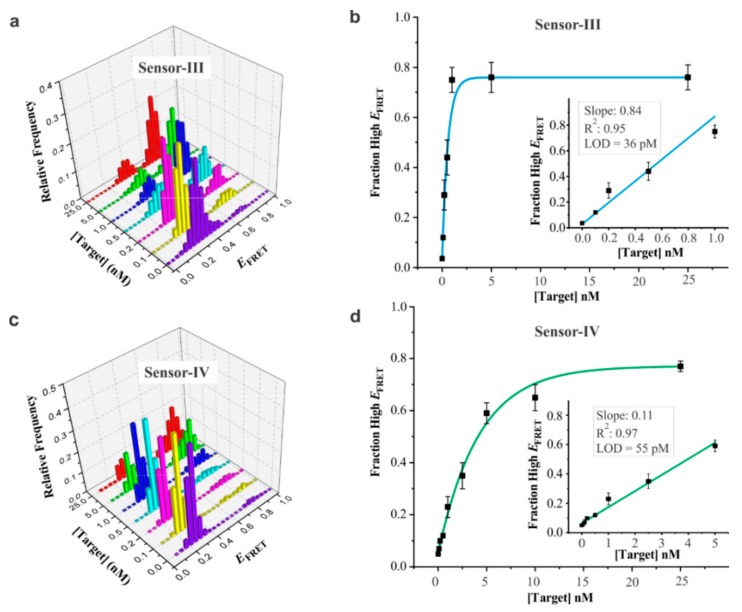
Analytical sensitivity of DNA sensors. (a) smFRET histograms of sensor-III for different concentrations of the target (0, 0.1, 0.2, 0.5, 1, 5, and 25 nM). The 0 nM data represent control experiment in the absence of the target. (b) Calibration curve of sensor-III depicting fraction of high-EFRET population against target concentration. High-EFRET population was determined from the two-peak Gaussian fitting of the histograms in Figure 3a. Inset displays the linear region of the full titration curve. R2 value obtained from linear fitting was 0.95, and the limit of detection (LOD) was 36 pM, as determined using the equation, LOD = (3 × SDblank)/slope, where SDblank represents the standard deviation of high-EFRET fraction in the absence of the target. (c) smFRET histograms of sensor-IV for different concentrations of the target. (d) Calibration curve of sensor-IV. Inset depicts the linear fitting region. R2 value from linear fit was 0.97, and the detection limit was calculated to be 55 pM. Error bars in (b) and (d) represent the standard deviations (SD), n = 3. Each EFRET histogram was prepared from 90–110 molecules.

