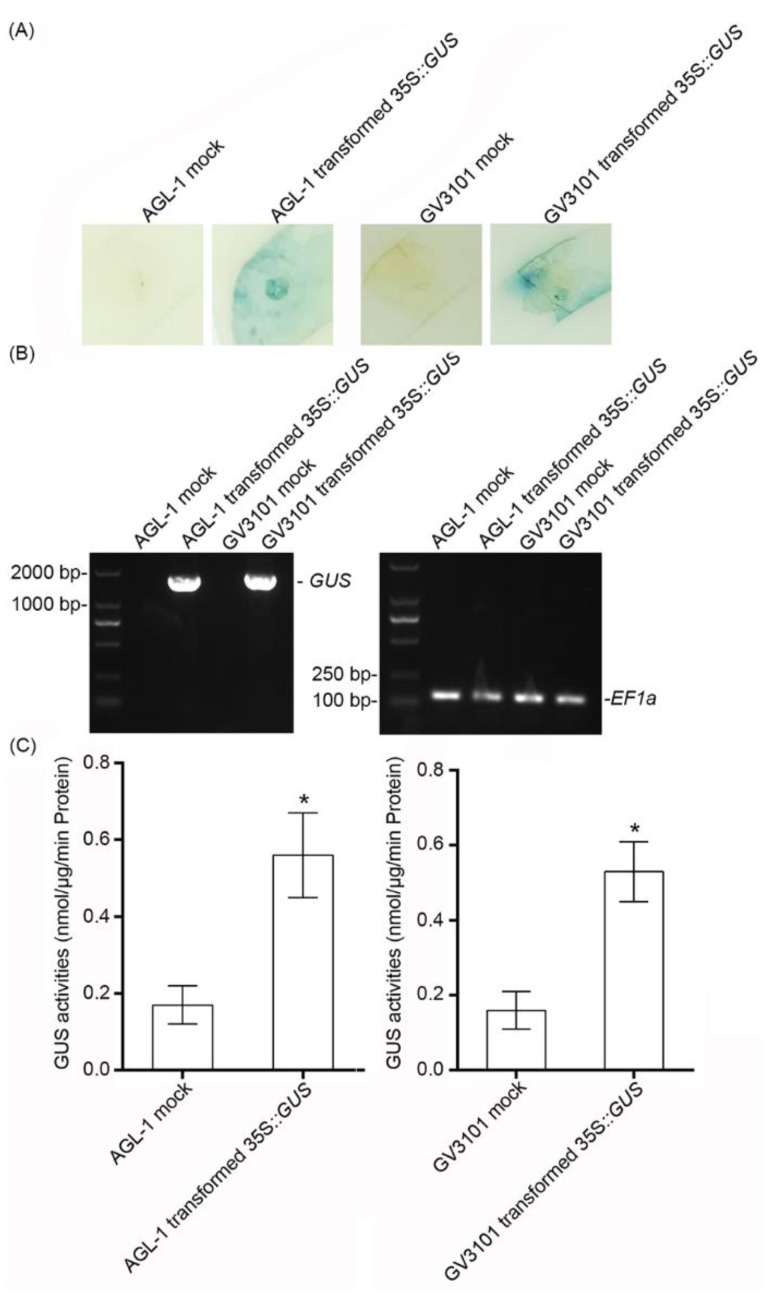
Figure 3.
Analysis of transient expression of β-glucuronidase (GUS) in cassava leaves. (A) At 2 dpi, Agrobacterium with no plasmid was used as the mock, and Agrobacterium containing 35S::GUS was used as the sample. The leaves were stained using GUS staining solution. Bar = 1 cm. (B) The relative transcript level of GUS is shown by reverse-transcription PCR, and EF1 was used as a reference gene. (C) The GUS activities of infiltrated leaves. Statistical tests were performed using IBM SPSS (v21). Briefly, the Kolmogorov–Smirnov test and Levene’s test were performed to check the normality of the data distribution and the homogeneity of variance of the data, respectively. The statistical analysis was performed using Student’s t-test and the Tukey–Kramer test. Asterisk symbol (*) indicates significant difference at p < 0.05. n = 10 per group. All data are expressed as mean ± SD of three independent experiments.

