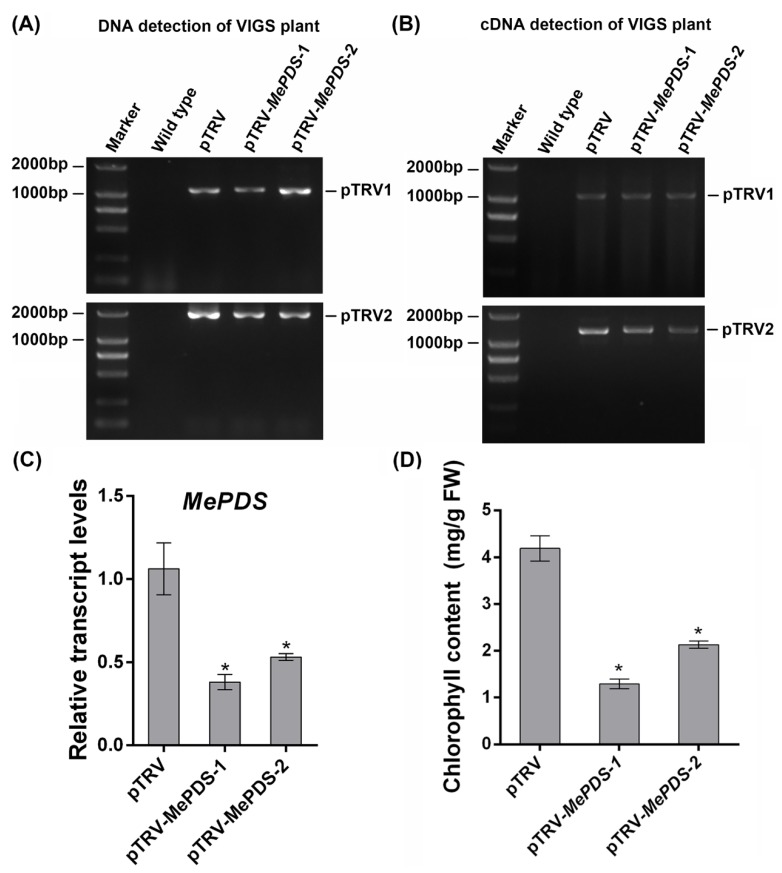
Figure 5.
Detection of VIGS cassava plants. (A) PCR detection of pTRV1 and pTRV2 sequences from the genomic DNA of VIGS cassava plants. (B) Reverse-transcription PCR detection of pTRV1 and pTRV2 sequences from the cDNA of VIGS cassava plants. (C) The relative transcript levels of MePDS of the infiltrated cassava plants. MeEF1 was used as internal control. (D) The chlorophyll contents in the infiltrated cassava plants. Statistical tests were performed using IBM SPSS (v21). Briefly, the Kolmogorov–Smirnov test and Levene’s test were performed to check the normality of the data distribution and the homogeneity of variance of the data, respectively. The statistical analysis was performed using Student’s t-test and the Tukey–Kramer test. Asterisk symbol (*) indicates significant difference at p < 0.05. All data are expressed as mean ± SD of three independent experiments.

