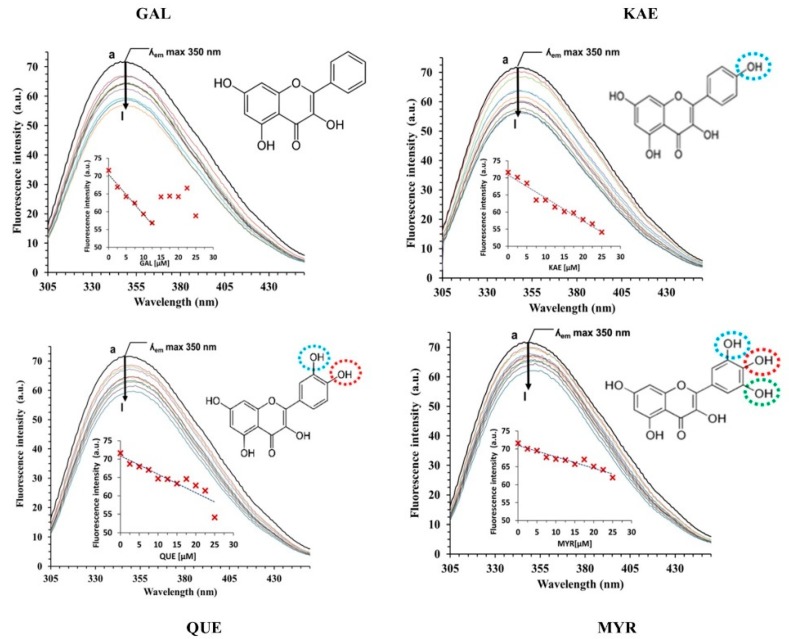
Figure 3.
Fluorescence emission spectra of CpLIP2 lipase alone or with increasing concentrations of single flavonols (coloured lignes). The concentration of CpLIP2 was 2.5 µM, and the final concentrations of flavonols correspond to the following gradient from a to l (see arrow): 0, 2.5, 5.0, 7.5, 10.0, 12.5, 15.0,17.5, 20.0, 22.5 and 25 µM of GAL (galangin), KAE (kaempferol), QUE (quercetin), and MYR (myricetin). Measurements at 293 K, pH: 7.0, 300 mM NaCl; EtOH 0.1%. The excitation wavelength was 285 nm, and the emission spectra was recorded in the wavelength range of 305–450 nm. Increment slits 1 nm. Corrections of inner filter was applied to all spectra. The four insert plots represent the fluorescence intensities at ʎem = 350 nm as a function of quencher concentrations.

