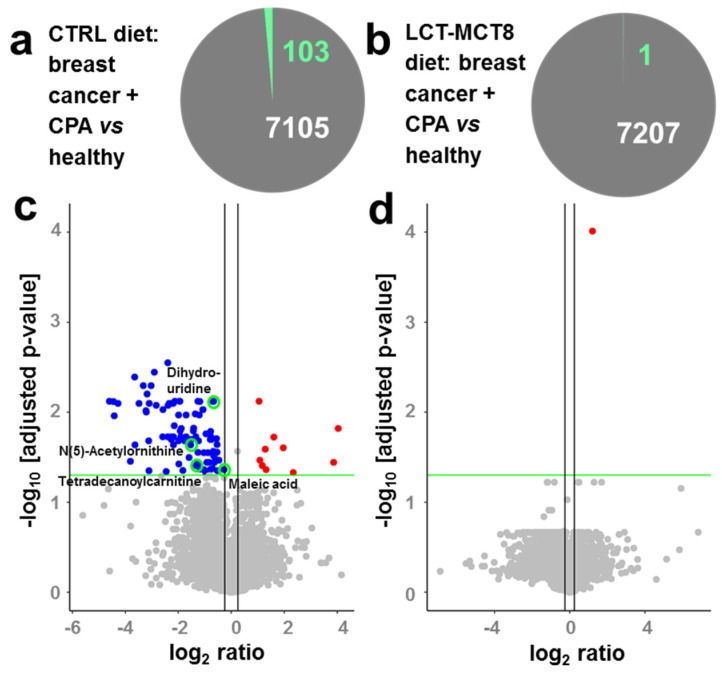
Figure 2.
Pie charts (a,b) and corresponding volcano plots (c,d) showing significantly regulated features induced by breast cancer under chemotherapy in mice receiving a control diet (a,c) and a ketogenic diet (KD) (b,d), respectively. The volcano plots show the negative log p-value (linear models for microarray data (LIMMA) followed by Benjamini–Hochberg correction) against log2 ratios of regulations induced by breast cancer under chemotherapy. Blue dots represent down-regulated, red dots up-regulated, and grey dots non-regulated features with a significance threshold of 0.05 (green line). Vertical black lines indicate log2 ratios of −0.25 and 0.25. Green circles indicate identified metabolites.

