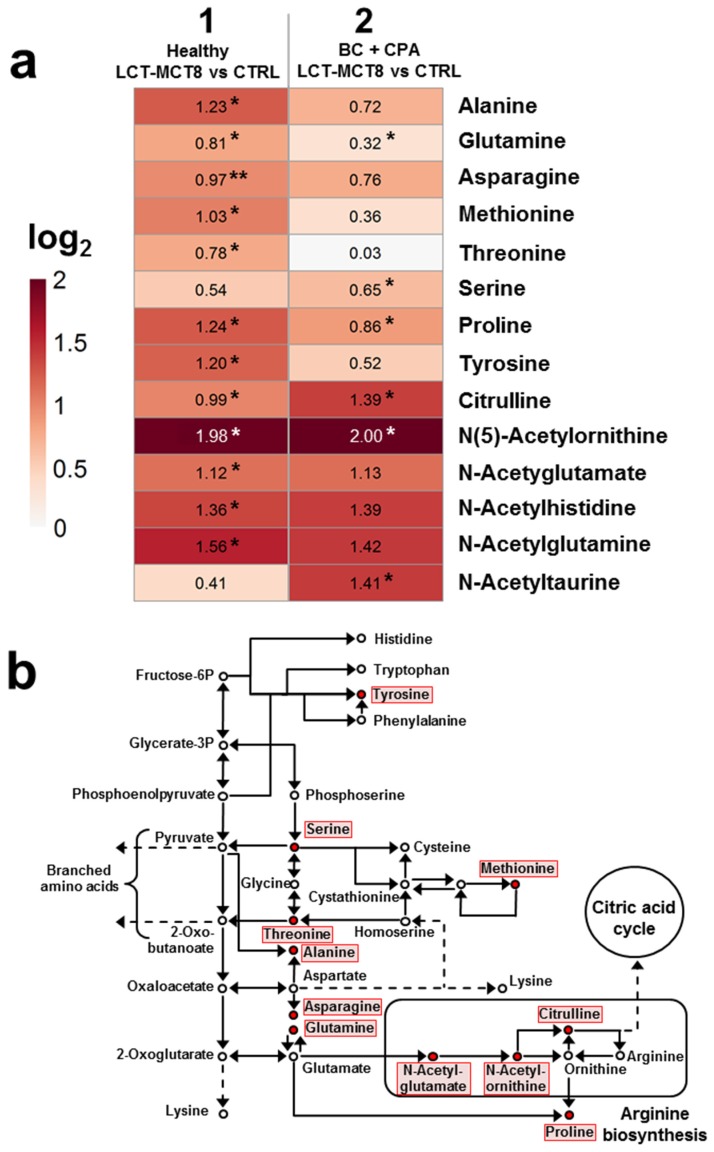
Figure 5.
Heatmap of significantly regulated metabolites involved in amino acid biosynthesis induced by breast cancer under chemotherapy and KD, respectively (a) and pathway map of amino acid biosynthesis (b). Red dots in the pathway map [39,40,41] indicate metabolites showing a significant regulation induced by LCT-MCT8 diet in healthy and/or in breast cancer bearing mice.

