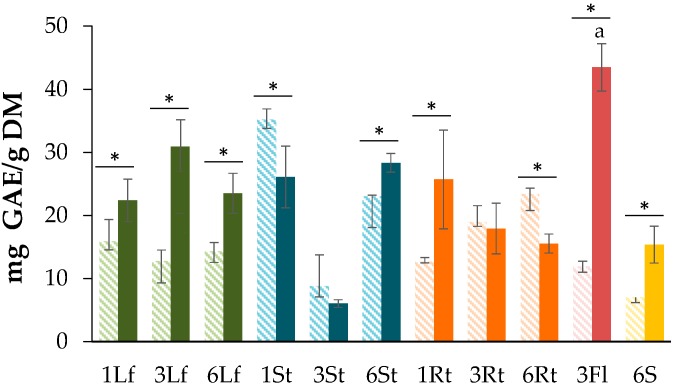
Figure 1.
Total phenolic content (TPC) of Chenopodium quinoa processed by air-drying (dash bars) and freeze-drying (dark bars) at different times after seeding (1, 3, 6 months) of different plant parts (leaves (Lf), stems (St), roots (Rt), seeds (S), and flowers (Fl)). Each bar represents the mean ± standard deviation (n = 3). Significant differences between plant parts (p = 0.00432 < 0.01) were found. Letters represent significant differences between treatments analyzed by the Tukey test (p < 0.05). * p < 0.05 when compared between drying methods.

