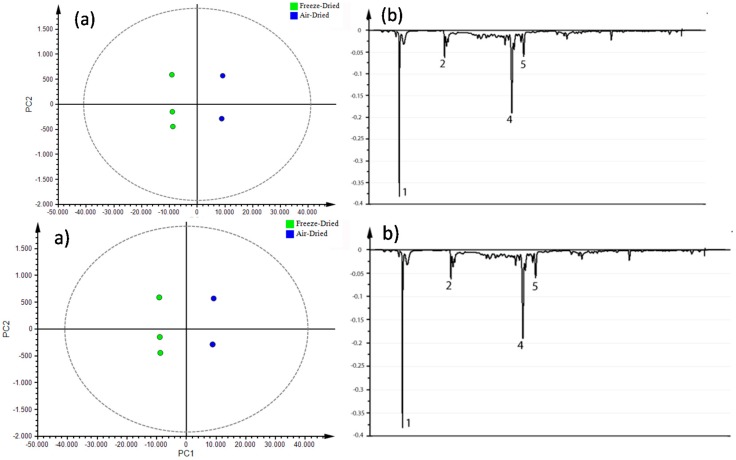
Figure 8.
(a) OPLS-DA score plot for individual flower extracts profiled by LC/MS used for testing, discriminated by drying process method. Internal cross-validation produced a Q2 of 0.890, clearly well within acceptable limits. Centered autoscaling. (b) Loading line of metabolites detected by LC/MS with annotated compounds: Scopoletin (1), naphthalenone (2), rhamnetin 3-glucoside (4), and unidentified compound (5) with an m/z of 492.

