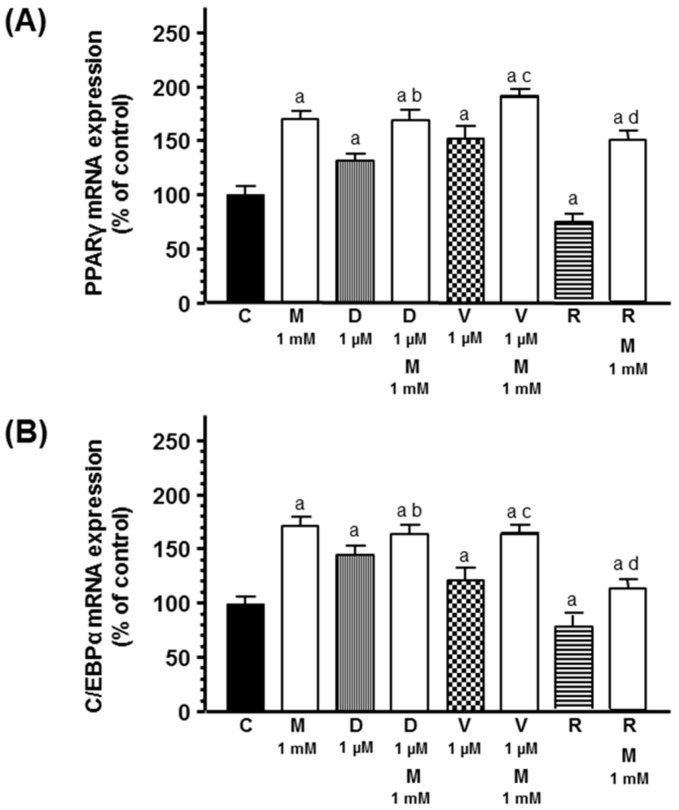
Figure 6.
Effects of melatonin on docetaxel-, vinorelbine-, and radiation-induced changes on (A) PPARγ and (B) C/EBPα mRNA expression. Data are expressed as the percentage of control group (mean ± SEM). a, p < 0.01 vs. C; b, p < 0.05 vs. D (1 µM); c, p < 0.01 vs. V (1 µM); d, p < 0.01 vs. R. C: control, M: melatonin, D: docetaxel, V: vinorelbine, R: radiation.

