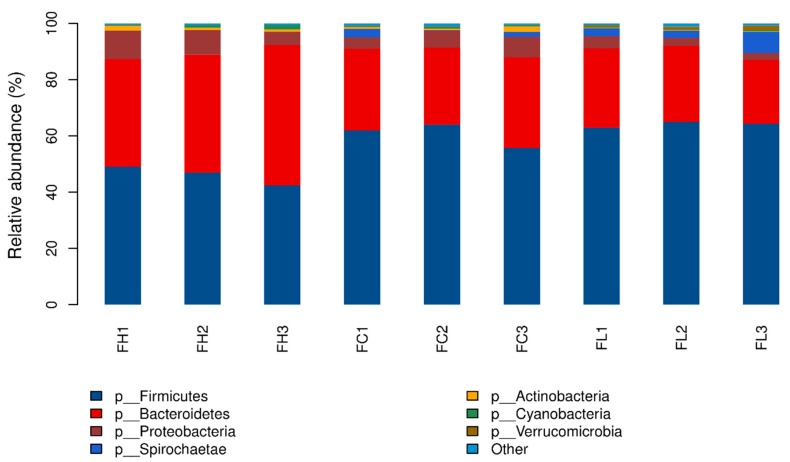
Figure 1.
The relative abundance of fecal bacterial composition at the phylum level. FH, FC, and FL indicate stepwise high energy and protein diet group, standard energy and protein diet group, and low energy and protein diet group, respectively. Numbers 1–3 indicate phase 1, phase 2, and phase 3 of the fattening stage, respectively.

