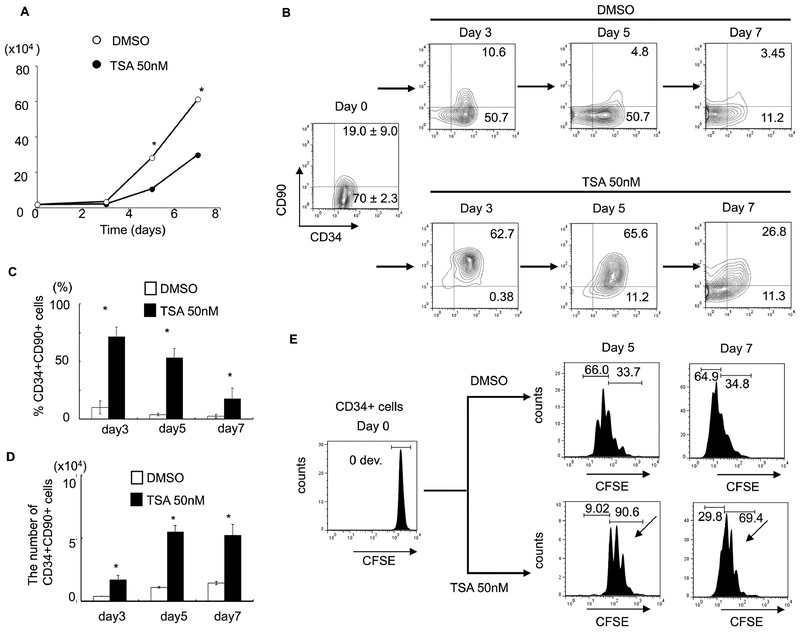
Figure 2. TSA-treated culture leads to preferential expansion of slowly dividing PBSC CD34+CD90+ cells.
(A) Cell growth of PBSC CD34+ cells cultured in the presence of cytokines with TSA or DMSO at various concentration of TSA after 5 days of culture. The data shown are the mean of three independent experiments. Error bars indicate SD. (B) Time course experiment from day 0 to 7 days showing that TSA increased in the number of CD34+CD90+ cells. The data shown are the mean of three independent experiments. (C) Percentage of CD34+CD90+ cells at 3, 5 and 7 days of culture in the presence or the absence of 50nM TSA. Error bars indicate SD; * indicates p<0.05. (D) Absolute number of CD34+CD90+ cells at 3, 5 and 7 days of culture in the presence or the absence of 50nM TSA. Error bars indicate SD; * indicates p<0.05. (E) CSFE-labeled CD34+ cells were cultured in the presence of cytokines with TSA or DMSO treatment for 7 days. The panel shows a representative (1 of 3 experiment) flow cytometric profile of CFSE fluorescence intensity after 5 and 7 days of culture. The arrow indicates the fraction of cells that have undergone fewer cell divisions when compared to CD34+CD90− cells.

