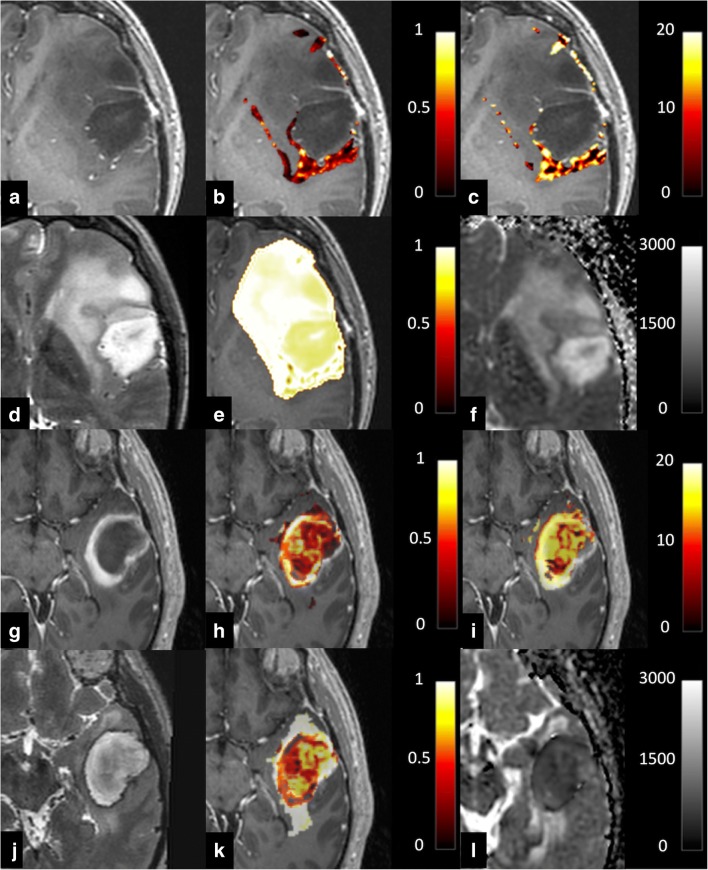
Fig. 2.
a–f Representative images from a low-grade glioma. a Axial post-gadolinium 3D T1-weighted imaging (T1WI). b Intracellular volume fraction. c Cell radius maps. d Axial T2WI. e Extracellular volume fraction. f ADC map, with a scale of × 10−6 mm2/s. Colour maps for b, c, e have been superimposed on the greyscale image from a with the colour scale shown for each image. g–l Representative images from a high-grade glioma. g Axial post-gadolinium 3D T1WI. h Intracellular volume fraction. i Cell radius maps. j Axial T2WI. k Extracellular volume fraction. l ADC map, with a scale of × 10−6 mm2/s. Colour maps for h, i, k have been superimposed on the greyscale image from a with the colour scale shown for each image

