Figure 1.
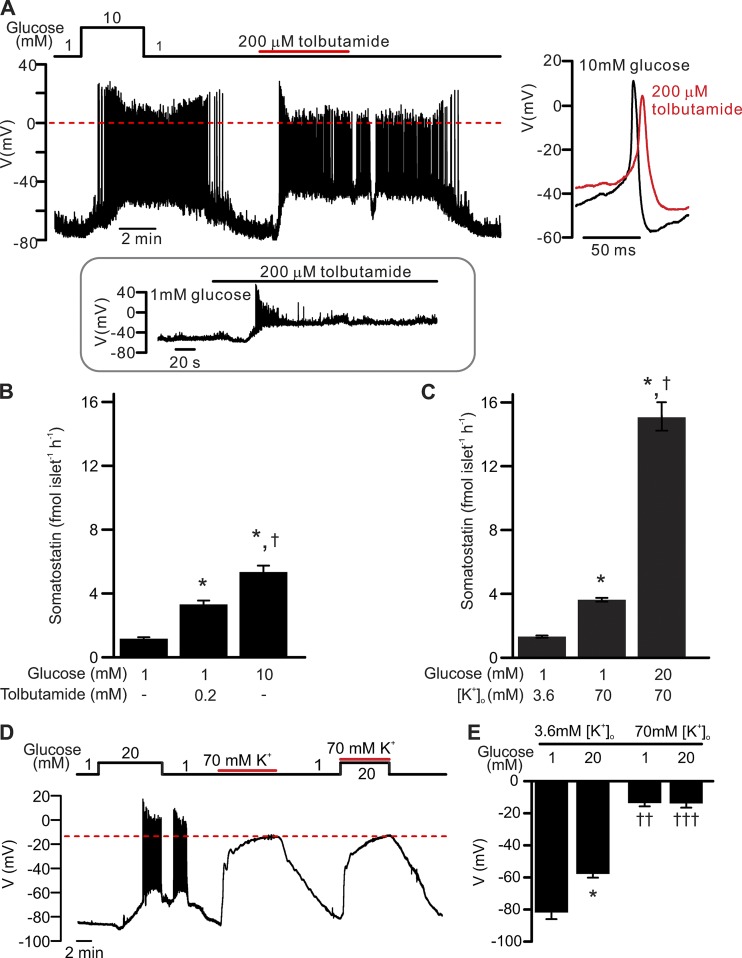
δ-cell electrical activity and somatostatin secretion. Relative roles of membrane depolarization and intracellular events in the regulation of somatostatin release–membrane depolarization in the absence of glucose is a weak stimulus for somatostatin secretion. (A) Electrical activity recorded from a δ-cell within an intact islet exposed to 1 mM glucose, 10 mM glucose, or 200 µM tolbutamide as indicated. The recording shown is representative of 11 out of a total 13 similar independent experiments. Zero mV is indicated by the red dashed line. Right panel shows examples of single action potentials recorded in 10 mM glucose (black) or tolbutamide (red) on an expanded time scale. Inset: Transient stimulation of electrical activity by tolbutamide in a δ-cell exposed to 1 mM glucose (seen in 2 out of 13 experiments). (B) Somatostatin secretion measured at 1 mM glucose (n = 20), 1 mM glucose in the presence of 0.2 mM tolbutamide (n = 10), and 10 mM glucose (n = 20) as indicated. *, P < 0.05 vs. 1 mM glucose; †, P < 0.05 vs. 0.2 mM tolbutamide. Islets are from more than three animals for each experiment, and n represents the number of independent experiments. fmol islet−1h−1, femtomole per islet per hour. (C) Somatostatin secretion measured at 3.6 mM [K+]o with 1 mM glucose (n = 10) and at 70 mM [K+]o with 1 mM (n = 42) or 20 mM glucose (n = 20) as indicated. *, P < 0.05 vs. 1 mM glucose at 3.6 mM [K+]o; †, P < 0.05 vs. 1 mM glucose at 70 mM [K+]o. Islets were from more than three animals for each experiment, and n represents the number of independent experiments. (D) Electrical activity of a δ-cell in response to physiological (3.6 mM) or supraphysiological (70 mM) [K+]o (solid red lines) at 1 mM or 20 mM glucose (black line). Note that high [K+]o depolarized the δ-cell to identical membrane potential in the presence of 1 mM or 20 mM glucose (dashed red line). The recording represents three independent experiments of identical conditions. (E) Bar graph summarizing effects of glucose and [K+]o as indicated. *, P < 0.05 vs. 1 mM glucose at the same [K+]o; ††, P < 0.01; and †††, P < 0.001 vs. 3.6 mM [K+]o with the same glucose concentration. All membrane potential recordings were performed using the perforated patch clamp technique. In B, C, and E, data are presented as mean ± SEM of the number of independent experiments.

