Figure 10.
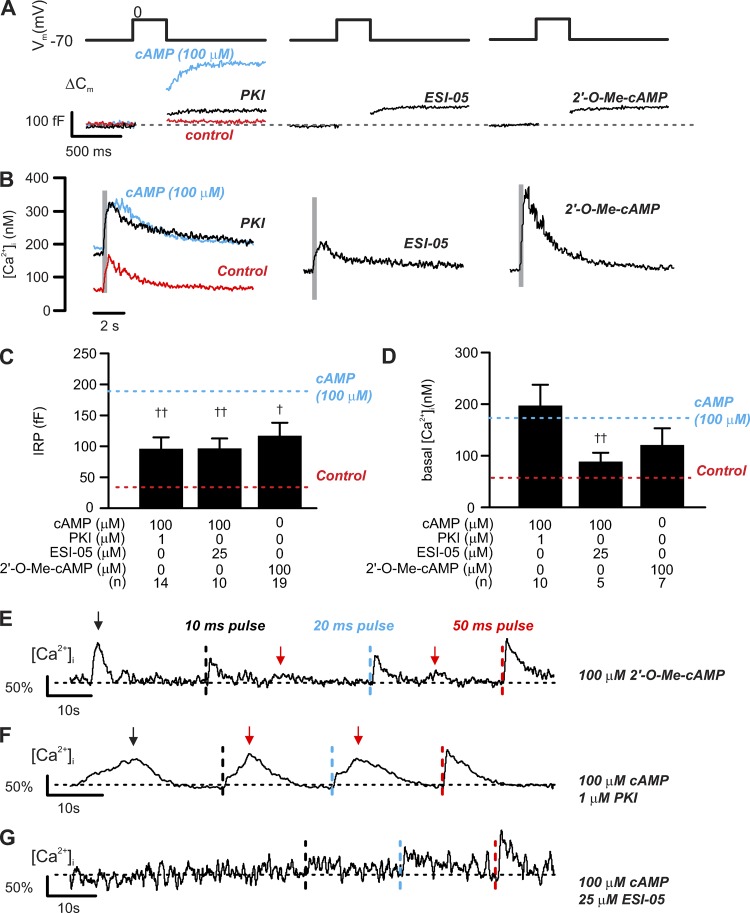
PKA-dependent and -independent effect of cAMP on δ-cell exocytosis. PKA and Epac2 differentially regulate depolarization-evoked exocytosis and [Ca2+]i increase. (A) Exocytosis (ΔCm; bottom) evoked by 300-ms depolarizations from −70 mV to 0 mV (top) in δ-cells dialyzed with cAMP (100 µM) together with inhibitors of PKA (PKI, 1 µM), Epac2 (ESI-05, 25 µM), or Epac2 agonist (2′-O-Me-cAMP, 100 µM) alone as indicated. (B) The averaged [Ca2+]i responses of experiments of the same conditions. In A and B, red and blue traces represent responses seen in control (without cAMP) and 100 µM cAMP, respectively, and are inserted here for comparison. Note that different time scales are used for the electrophysiological measurements and recordings of [Ca2+]i. Gray rectangles correspond to the 300-ms depolarizations from −70 to 0 mV. (C and D) IRP and basal [Ca2+]i determined under the indicated experimental conditions. Data are mean values ± SEM for indicated number of independent experiments (n) from 4–15 animals for each experimental condition. †, P < 0.05 and ††, P < 0.01 vs. 100 µM cAMP. Red and blue dotted lines indicate responses seen in control (without cAMP) and 100 µM cAMP, respectively. (E) [Ca2+]i recorded in δ-cells held at −70 mV and infused with Epac2 agonist (2′-O-Me-cAMP, 100 µM). Three consecutive depolarizations from −70 mV to 0 mV were applied with increasing durations: 10 ms (black dotted lines), 20 ms (blue dotted lines), and 50 ms (red dotted lines). Depolarizations were applied with >20-s intervals. (F and G) As in E, but cells were infused with solutions containing 100 µM cAMP with inclusion of PKI (1 µM; F) or ESI-05 (25 µM; G). Responses were normalized to the 50-ms depolarization-triggered [Ca2+]i transients. Recordings are representative of 7 (E), 10 (F), and 5 (G) independent experiments from four to eight animals. Black arrows above the traces indicate the spontaneous [Ca2+]i spikes before depolarization, and red arrows indicate the second increase in [Ca2+]i following depolarizations. All measurements were made using the standard whole-cell technique.

