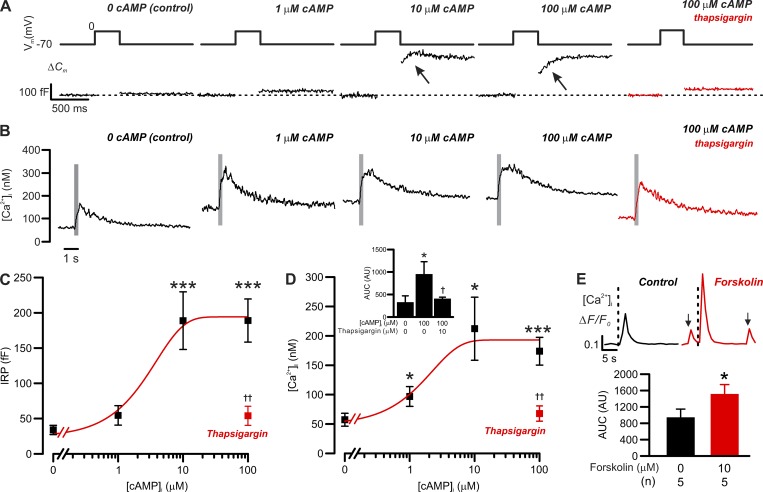
Figure 7.
cAMP-dependent increases in exocytosis and basal [Ca2+]i in δ-cells. Correlation between [cAMP]i and δ-cell [Ca2+]i/exocytosis. (A) Exocytosis (ΔCm; bottom) evoked by 300-ms depolarizations from −70 mV to 0 mV (top) in δ-cells dialyzed with cAMP at the indicated concentrations. Red trace shows the response with 100 µM cAMP following treatment with 10 µM thapsigargin. (B) As in A but showing the changes in cytoplasmic [Ca2+]i (on a compressed timescale). Gray areas mark the periods of 300-ms membrane depolarizations from −70 mV to 0 mV. Note that [Ca2+]i traces are averaged responses of experiments of the same conditions. (C) Summary of cAMP dose-dependent effect on δ-cell immediate releasable pool (IRP; n = 14 independent experiments for control, 6 for 1 µM cAMP, 5 for 10 µM cAMP, 6 for 100 µM cAMP, and 4 for 100 µM cAMP pretreated with 10 µM thapsigargin; ***, P < 0.001 vs. control). Red rectangle indicates the response with 100 µM cAMP following pretreatment with 10 µM thapsigargin for > 1 h. ††, P < 0.01 vs. 100 µM cAMP alone. (D) As in C but summarizes the response of basal [Ca2+]i (n = 9 independent experiments for control, 5 for 1 µM cAMP, 3 for 10 µM cAMP, 5 for 100 µM cAMP, and 4 for 100 µM cAMP pretreated with 10 µM thapsigargin for >1 h; *, P < 0.05 and ***, P < 0.001 vs. control). Red rectangle indicates the response with 100 µM cAMP following pretreatment with 10 µM thapsigargin. ††, P < 0.01 vs. 100 µM cAMP alone. In C and D, data are presented as mean values ± SEM for the number of independent experiments (n) from two to eight animals. Inset summarizes the AUC of depolarization-triggered [Ca2+]i transients in δ-cells infused with cAMP of the indicated concentrations. Red bar shows the response in thapsigargin-pretreated δ-cells infused with 100 µM cAMP. Data are mean values ± SEM for the number of independent experiments (n) from two to eight animals. *, P < 0.05 vs. control and †, P < 0.05 vs. 100 µM cAMP without thapsigargin pretreatment. (E) Bar graph shows the average AUC of [Ca2+]i transients triggered by 300-ms depolarizations before (black) and after application of 10 µM forskolin (red). Data are presented as mean values ± SEM of indicated numbers of independent experiments (n) from two animals. *, P < 0.05 vs. control (before forskolin application). Inset shows examples of 300-ms depolarizations (from −70 to 0 mV) triggered δ-cell [Ca2+]i transients, recorded in the same cells, before (control, black) and after the application of forskolin (forskolin, red) for 5 min. Onset of the depolarizing pulses is indicated by vertical dotted lines. Arrows indicate spontaneous Ca2+ spikes that were observed in the absence of membrane depolarization. The traces are aligned to the same baseline to facilitate the comparison of [Ca2+]i transient kinetics. Measurements in A–D were conducted using the standard whole-cell technique. Experiments in E were conducted using perforated patch clamp technique.

