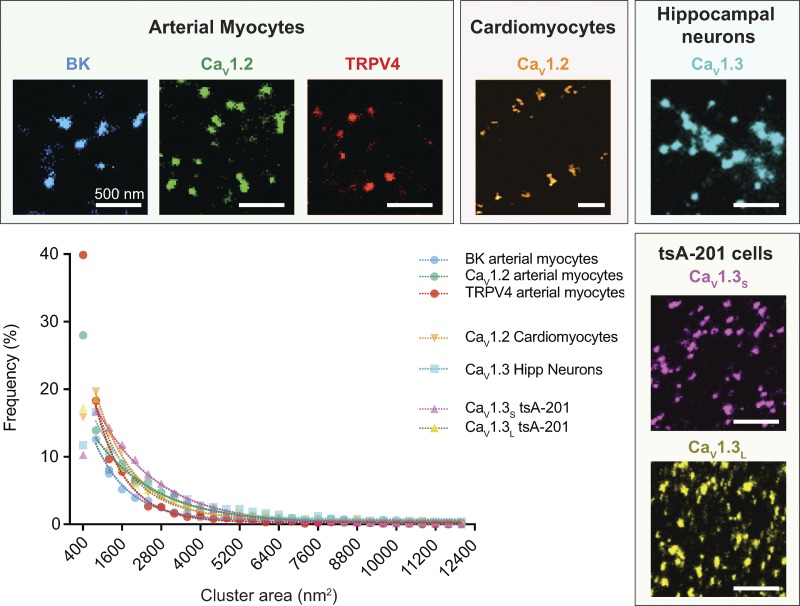
Figure 1.
BK, CaV1.2, TRPV4, and CaV1.3 channels organize in clusters in multiple cell types exhibiting an exponential cluster area distribution. Representative superresolution ground state depletion images of the cluster organization of endogenous BK (blue), CaV1.2 (green), and TRPV4 (red) channels in arterial myocytes, endogenous CaV1.2 (orange) channels in cardiomyocytes, endogenous CaV1.3 (light blue) channels in hippocampal neurons, and the two splicing variants CaV1.3S (pink) and CaV1.3L (yellow) expressed in tsA-201 cells. The plot summarizes the frequency distribution of the cluster areas for each channel. All the distributions were fit with a single exponential function. Average cluster areas and densities for each channel are presented in Table 2. TRPV4 data were modified from Tajada et al. (2017), CaV1.2 in cardiomyocytes was modified from Dixon et al. (2015), and CaV1.3 data were modified from Moreno et al. (2016).

