Figure 10.
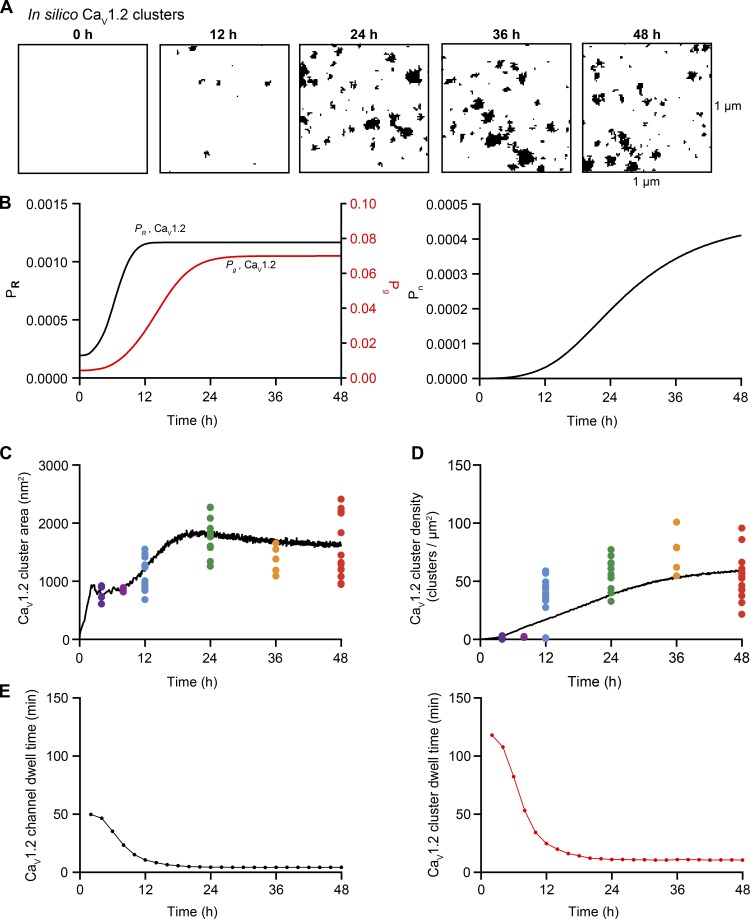
Feedback model for CaV1.2 cluster formation. (A) In silico images of CaV1.2 clusters at 0, 12, 24, 36, and 48 h after the initiation of expression. (B) Solutions to the feedback model equations , , and . (C and D) The black trace depicts the time course of mean cluster area (C) and density (D) of simulated CaV1.2 clusters. Colored dots represent the superimposed experimental data from Fig. 3. (E) Predicted mean CaV1.2 channel (black) and cluster dwell times (red) based on the feedback model.

