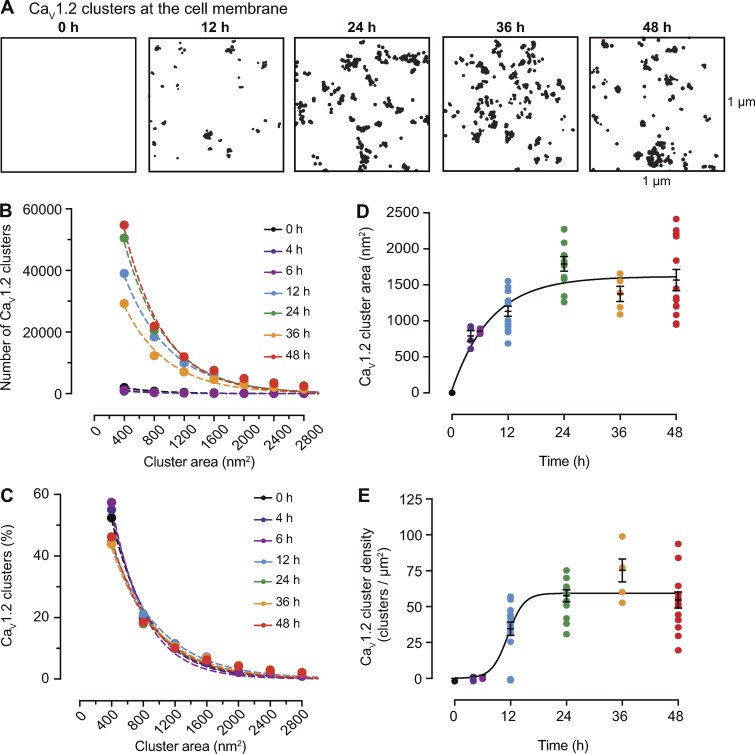
Figure 3.
Time course of the formation of CaV1.2 channel clusters in tsA-201 cells. (A) Representative superresolution GSD binary masks of immunolabeled CaV1.2 channels expressed in tsA-201 cells at 0, 12, 24, 36, and 48 h after transfection. (B) Frequency distribution of CaV1.2 channels cluster areas at each time point. (C) Relative frequency distribution of CaV1.2 channels cluster areas expressed as percentages. Dashed color lines in B and C represent the best single exponential decay function fit for each dataset. (D) Change of mean CaV1.2 channel cluster area at different time points after transfection. Data are presented as mean ± SEM for individual cells at each time point. Mean cluster area data were fit with a one-phase exponential equation (solid black line). The tau value of the fit is 8.37 h. (E) Change of CaV1.2 channel cluster density at different time points after transfection. Data are presented as mean ± SEM for individual cells at each time point. Mean cluster density data were fit with a sigmoidal function (solid black line). The logIC50 fit is 11.42 h. (B–E) All data were compiled as follows: 4 h: n = 1,497 clusters from 4 cells; 6 h: n = 2,100 clusters from 4 cells; 12 h: n = 87,209 clusters from 16 cells; 24 h: n = 114,805 clusters from 11 cells; 36 h: n = 66,769 clusters from 5 cells; 48 h: n = 118,281 clusters from 13 cells.

