Figure 4.
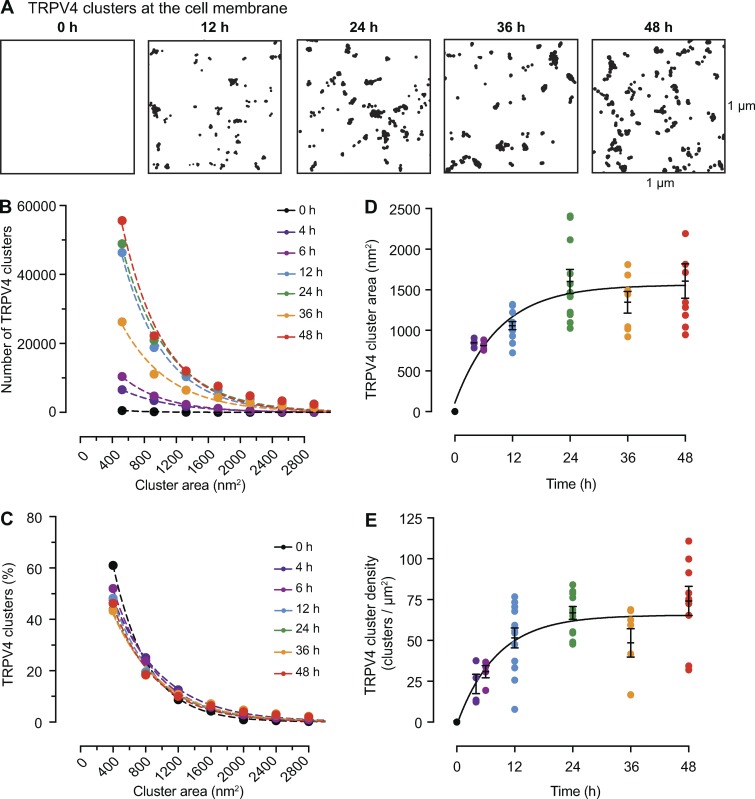
Time course of the formation of TRPV4 channel clusters in tsA-201 cells. (A) Representative superresolution GSD binary masks of immunolabeled TRPV4 channels in transfected tsA-201 cells at 0, 12, 24, 36, and 48 h after transfection. (B) Frequency distribution of TRPV4 channels cluster areas at each time point. (C) Relative frequency distribution of TRPV4 channels cluster areas expressed as percentages. Dashed color lines in B and C represent the best single exponential decay function fit for each dataset. (D) Change of mean TRPV4 channel cluster area at different time points after transfection. Data are presented as mean ± SEM for individual cells at each time point. (E) Change of TRPV4 channel cluster density at different time points after transfection. Data are presented as mean ± SEM for individual cells at each time point. Mean cluster area data (D) and mean cluster density data (E) were fit with a one-phase exponential equation (solid black line). The tau values for cluster area and cluster density are 9.17 and 8.22 h, respectively. (B–E) All data were compiled as follows: 4 h: n = 13,734 from 4 cells; 6 h: 20,004 clusters from 4 cells; 12 h: n = 96,295 clusters from 12 cells; 24 h: n = 111,632 clusters from 11 cells; 36 h: n = 60,518 clusters from 7 cells, 48 h: n = 120,416 from 12 cells.

