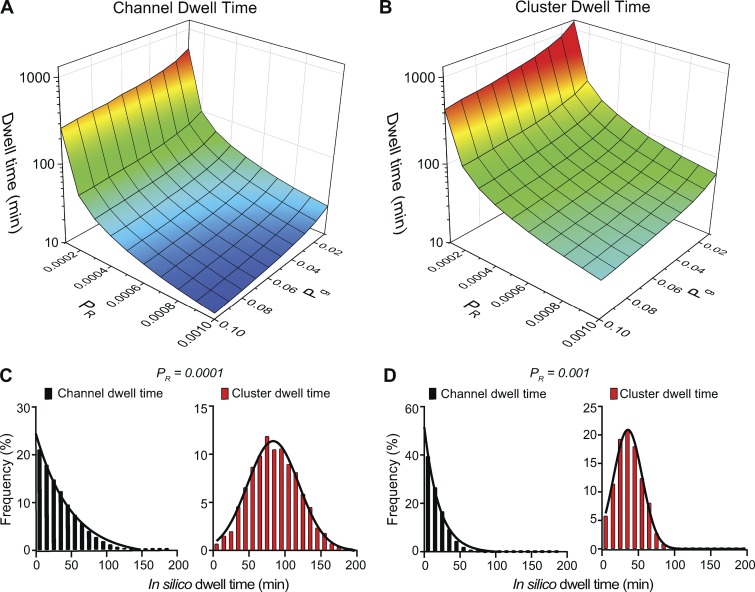
Figure 6.
Pgand PR determine channel and cluster dwell time. (A and B) Surface plots showing the relationships between Pg, PR, and channel dwell time (A) or cluster dwell time (B). (C and D) Frequency distributions of channel and cluster dwell times with PR equal to 0.0001 (C) or 0.001 (D). For the simulations in C and D, Pg and Pn were 0.01 and 0.00006, respectively.

