Figure 7.
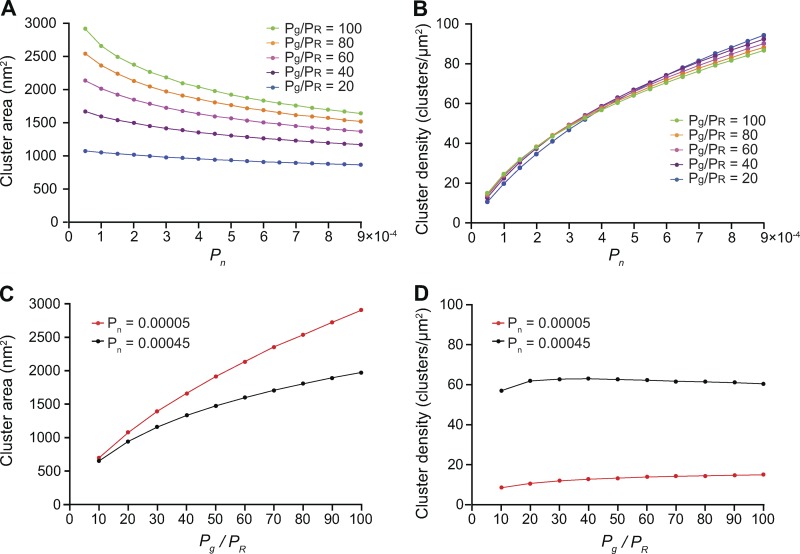
In silico stochastic self-assembly of protein clusters with realistic sizes and densities. (A) Plot of the relationships between Pn and cluster area at Pg/PR ratios equal to 20 (Pg = 0.07, PR = 0.0035), 40 (Pg = 0.07, PR = 0.00175), 60 (Pg = 0.07, PR = 0.001166667), 80 (Pg = 0.07, PR = 0.000875), and 100 (Pg = 0.07, PR = 0.0007). (B) Relationships between Pn and cluster density at Pg/PR ratios equal to 20 (Pg = 0.07, PR = 0.0035), 40 (Pg = 0.07, PR = 0.00175), 60 (Pg = 0.07, PR = 0.001166667), 80 (Pg = 0.07, PR = 0.000875), and 100 (Pg = 0.07, PR = 0.0007). For simulations in A and B, we averaged cluster area and density values at steady state for 2,000 iterations. (C) Effect of Pg/PR ratios on cluster area. (D) Effect of Pg/PR ratios on cluster density. (C and D) For these simulations, we set the value of Pn = 0.00005 (red traces) and Pn = 0.00045 (black traces), Pg = 0.07 and PR ranged between 0.007 and 0.0007 to achieve Pg/PR ratios of 10–100.

