Figure 9.
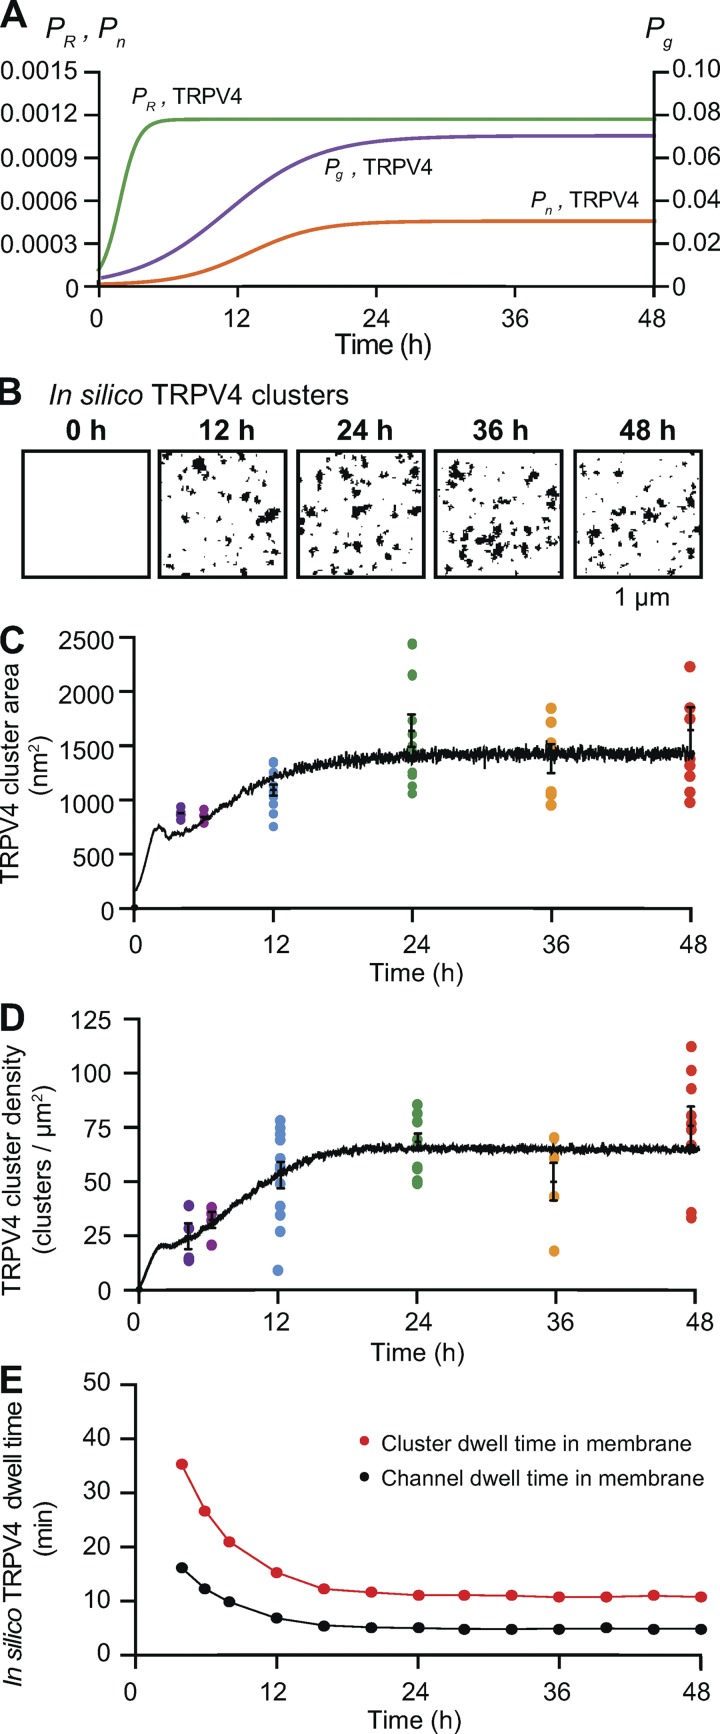
Sigmoidal time-dependent changes in Pg, Pn, and PR reproduce the time course of TRPV4 cluster formation in the plasma membrane of tsA-201 cells. (A) Plots of Pg,TRPV4 (purple), Pn,TRPV4 (orange), and PR,TRPV4 (green) versus time. , , and . (B) In silico images of TRPV4 clusters at 0, 12, 24, 36, and 48 h after the initiation of expression using the parameters in A. (C and D) The black trace depicts the time course of mean cluster area (C) and densities of simulated clusters (D). Colored dots represent the superimposed experimental data from Fig. 4. (E) Mean TRPV4 channel (black) and cluster (red) dwell times based on the sigmoidal functions Pg, Pn, and PR.

