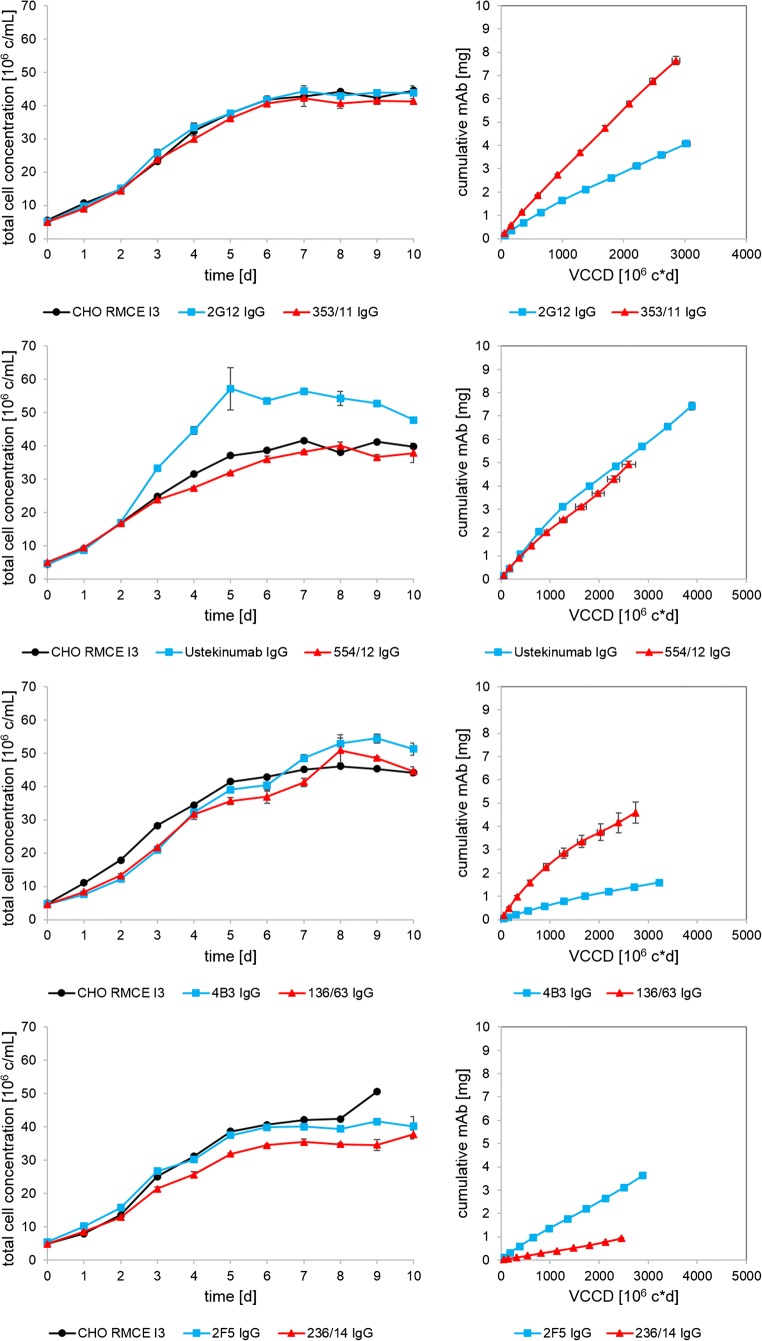
Fig. 1.
Total cell concentrations and total viable cumulative cell days (VCCD) versus cumulative mAb concentration of semi-continuous perfusion cultures: 2G12, Ustekinumab, 4B3, 2F5, and corresponding germline variants. Values represent the mean of three replicates in one single run; error bars show standard deviation. The host cell line CHO RMCE I3 control (black) is a single tube in each run

