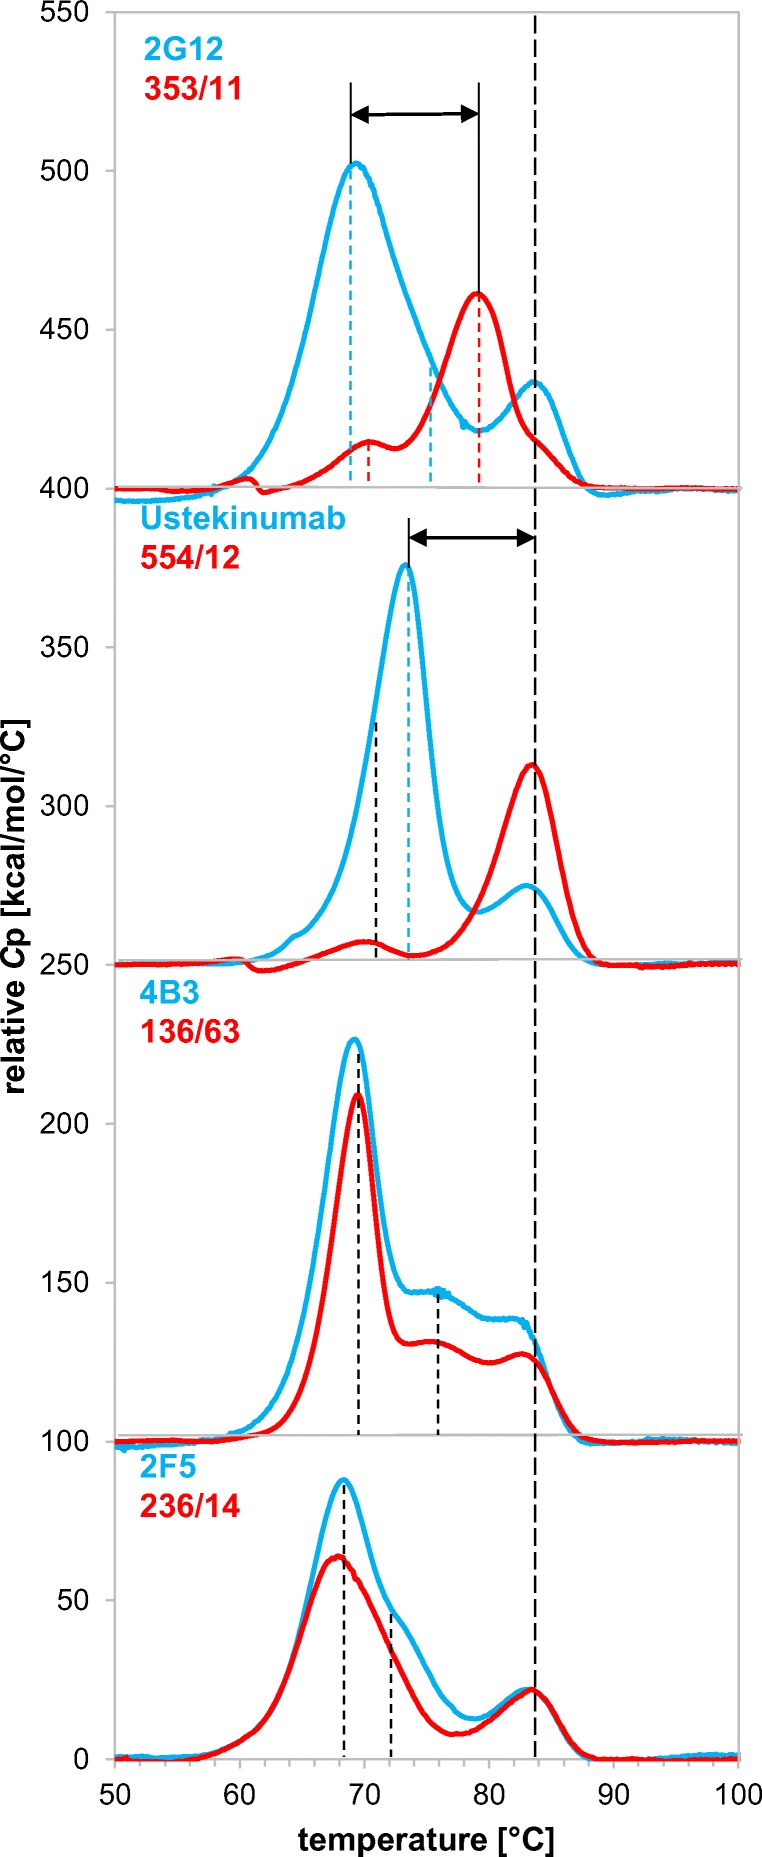
Fig. 4.

Differential scanning calorimetry (DSC) scan of 2G12, Ustekinumab, 4B3, 2F5, and corresponding germline variants. Vertical dashed lines mark the respective endothermic transition midpoints. Black arrows indicate the transition difference of mAb pairs
