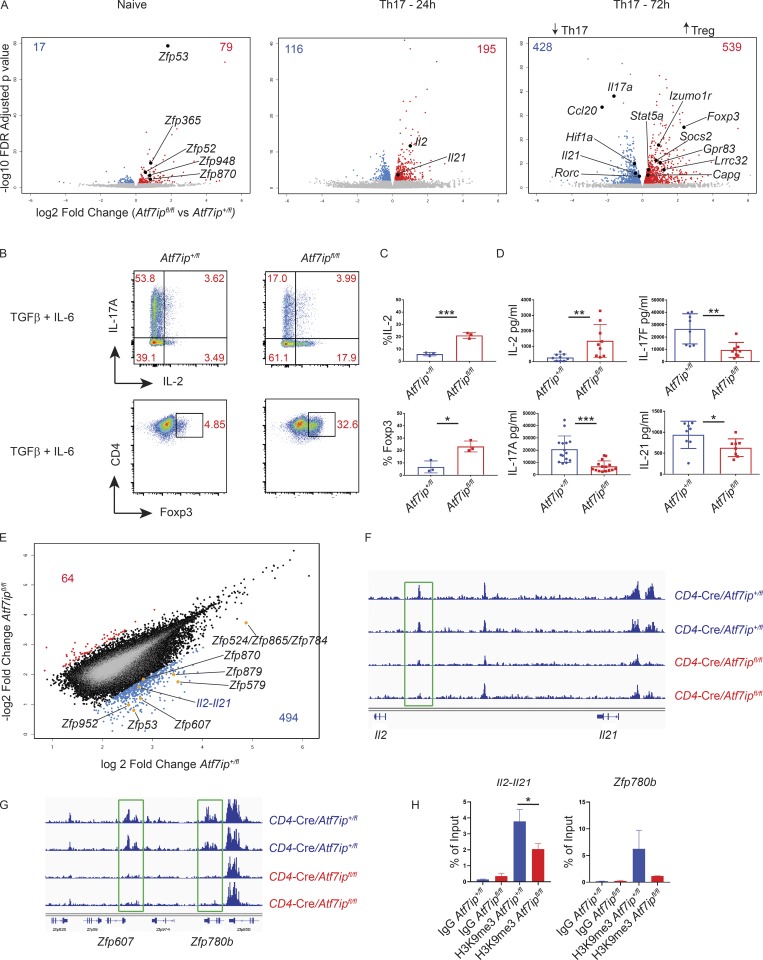
Figure 3.
CD4-Cre/Atf7ipfl/fl T cells have increased Il2 and a decreased Th17 gene signature secondary to less H3K9me3 at the Il2-Il21 intergenic region. (A) Volcano plots from RNA-seq data comparing global gene expression analysis of T cells from CD4-Cre/Atf7ipfl/fl mice and CD4-Cre/Atf7ip+/fl mice. Left plot represents naive T cells, middle plot is T cells differentiated for 24 h under Th17-inducing conditions, and right plot is 72 h of Th17-inducing conditions. Red numbers indicate the number of genes that are significantly increased (FDR <0.01) in CD4-Cre/Atf7ipfl/fl T cells, and blue numbers indicate the number of genes that are significantly increased in CD4-Cre/Atf7ip+/fl T cells. RNA-seq was performed in triplicate for each condition. (B) Naive T cells from CD4-Cre/Atf7ip+/fl (Atf7ip+/fl) and CD4-Cre/Atf7ipfl/fl (Atf7ipfl/fl) mice were in vitro differentiated for 4 d under Th17-inducing conditions (IL-6 + TGFβ) and analyzed by flow cytometric analysis for intracellular cytokines (IL-17A, IL-2) or Foxp3. (C) Summary of flow cytometric data in B. (D) ELISA of secreted cytokines (IL-17A, IL-2, IL-17F, and IL-21) from Th17 culture supernatant. (E–G) ChIP-seq data for H3K9me3 from CD4-Cre/Atf7ip+/fl (Atf7ip+/fl) and CD4-Cre/Atf7ipfl/fl (Atf7ipfl/fl) naive T cells performed in duplicate. (E) Scatterplot comparing log2 fold change of H3K9me3 in CD4-Cre/Atf7ip+/fl (Atf7ip+/fl) and CD4-Cre/Atf7ipfl/fl (Atf7ipfl/fl) naive T cells. Blue numbers represent the number of loci with twofold increased H3K9me3 in CD4-Cre/Atf7ip+/fl naive T cells compared with CD4-Cre/Atf7ipfl/fl naive T cells. Red numbers indicate the number of loci with twofold increased H3K9me3 in CD4-Cre/Atf7ipfl/fl naive T cells. (F) Integrated genome viewer H3K9me3 ChIP-seq tracings for the Il2-Il21 intergenic region. (G) Integrated genome viewer H3K9me3 ChIP-seq tracings for the indicated zinc finger proteins (Zfp). Green boxes show sites of twofold decreased H3K9me3 deposition. (H) H3K9me3 ChIP qPCR targeting the site of H3K9me3 deposition within the Il2-Il21 intergenic region and within the Zfp780b gene. Each data point represents an individual mouse. Data in B and C are one representative experiment of three experiments with three mice per group. Data in D are the combination of three experiments with two to three mice per group. Error bars are mean with SD (C and D) and mean and SD of technical replicates (H). *, P < 0.05; **, P < 0.01; ***, P < 0.001 by Student’s t test.

