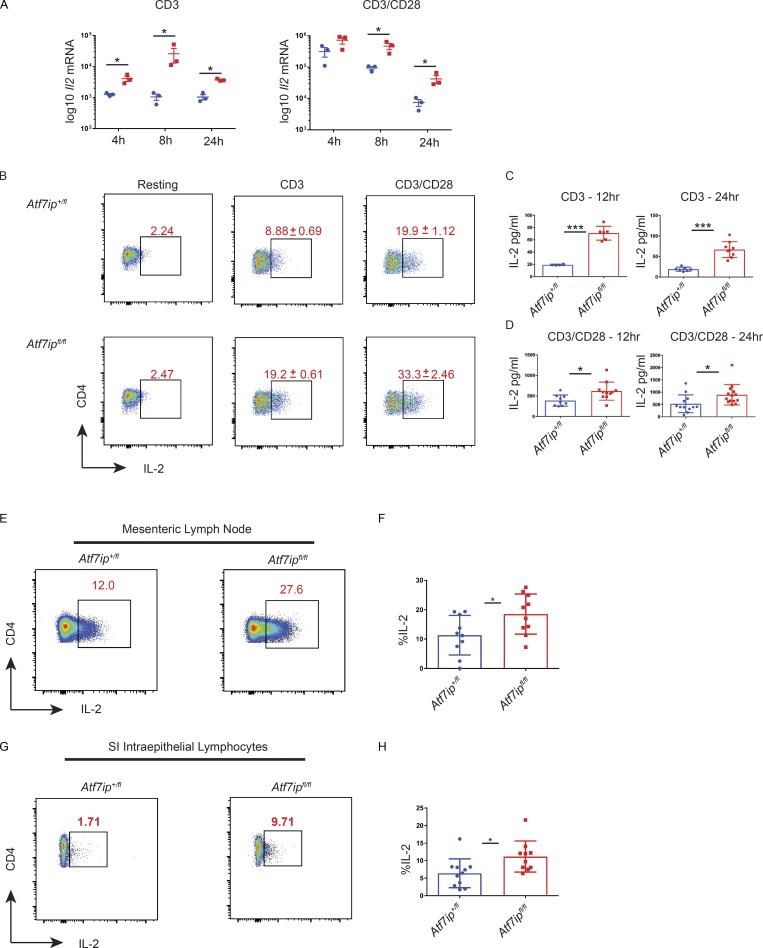
Figure 4.
CD4-Cre/Atf7ipfl/fl T cells produce increased IL-2 with TCR stimulation. Naive T cells were stimulated for 12–24 h in the presence of TCR stimulation (2 µg anti-CD3) or with both TCR stimulation (2 µg anti-CD3) and costimulation (2 µg anti-CD28). (A) qPCR for Il2 mRNA. (B) Flow cytometric data for IL-2 with ± SD shown. (C and D) IL-2 ELISA from culture supernatant. (E and G) Representative flow cytometry of IL-2 expression in the mesenteric LN (E) or small intestine IELs (G) 48 h after in vivo anti-CD3 treatment. (F and H) Summary of flow cytometry data from the mesenteric LN (E) and small intestine (SI) IELs (G). Each data point represents an individual mouse. Data in A and B are representative of two experiments with three mice per genotype. Data in C, D, F, and H are the combination of three experiments with three to four mice per genotype. Error bars are SEM (A) and mean with SD (B–D, F, and H). *, P < 0.05; ***, P < 0.001 by Student’s t test.

