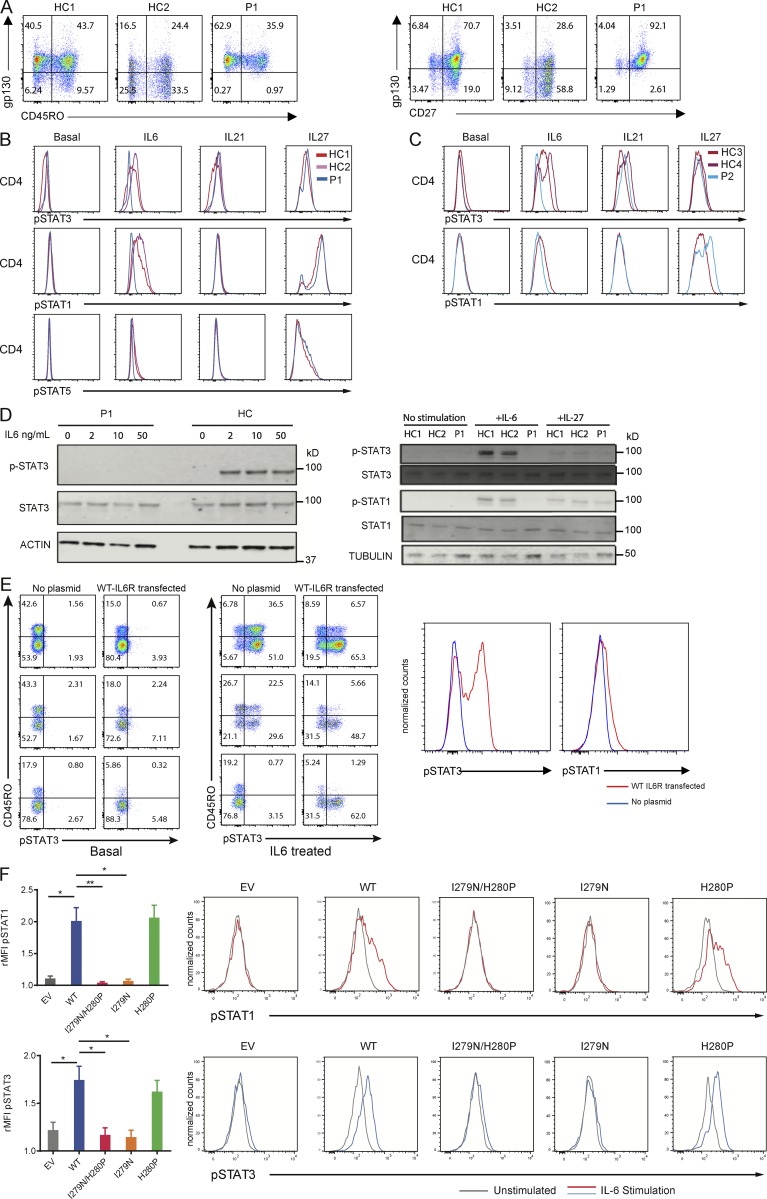
Figure 2.
STAT signaling responses with and without ectopic expression of IL-6R in two patients with IL6R mutations. (A) Left: Dot plots of GP130 and CD45RO of gated CD3+CD4+ T cells from P1 and two healthy controls (HCs). Right: Dot plots of gp130 and CD27 of gated CD3+CD4+ T cells from P1. (B) Fluorescence histograms of the indicated anti-pSTAT proteins’ expression in CD4+ T cells from healthy controls and P1 upon stimulation. (C) Fluorescence histograms of the indicated anti-pSTAT proteins’ expression in CD4+ T cells from healthy controls and P2. (D) Left: Western blot of pSTAT3, STAT3, and actin as a loading control in P1 and healthy control PBMCs stimulated with the indicated IL-6 concentration for 30 min. Right: Western blot of pSTAT3, STAT3, pSTAT1, STAT1, and tubulin as a loading control in patient and healthy controls. PBMCs stimulated with the indicated cytokine concentrations for 30 min. (E) Left: pSTAT3 in healthy controls’ and IL-6R–null (P1) CD4+ T cells, transfected with a vector expressing WT IL-6R at baseline and after IL-6 stimulation. Right: The overlaid fluorescence histograms of pSTAT3 and pSTAT1 in PBMCs from the IL-6R–null patient in WT-IL-6R transfected and untransfected cells stimulated with IL-6. (F) Bar graphs indicating relative mean fluorescence intensity (rMFI) of pSTAT1 and pSTAT3 upon IL-6 stimulation of HEK293 T cells transfected with WT IL-6R, p.I279N/p.H280P IL6-R, p.I279N IL6-R, p.H280P IL6-R, or an empty vector (EV). Representative histograms are shown for each condition. Data represent two replicates of three independent experiments (unpaired two-tailed Student’s t test done on mean of technical replicates; *, P < 0.05; **, P < 0.01). Error bars represent SEM.

