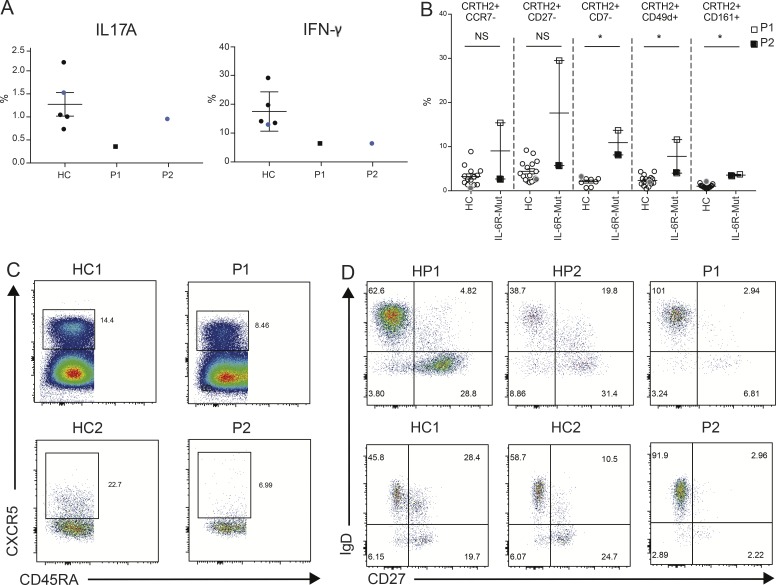
Figure 4.
Immunophenotype of patients with IL6R mutations. (A) Percentages of IL-17A–producing (left) and IFNγ-producing (right) CD4+ T cells from healthy controls (HCs; n = 5), P1 (dark square), and P2 (blue circle) from two independent experiments. Black, data from experiment 1; blue, data from experiment 2. (B) Flow cytometry analysis of expression of markers found in pathological effector Th2 cells in CRTH2+ memory CD4+ T cells. Mann–Whitney U test; *, P < 0.05. (C) Flow cytometry analysis of blood CXCR5+ memory cTFHs in P1, P2, and healthy controls. (D) Flow cytometry assessment of B lymphocyte class switching and memory cell formation in P1, P2, and healthy controls and the healthy parents (HP). Error bars represent SEM.

