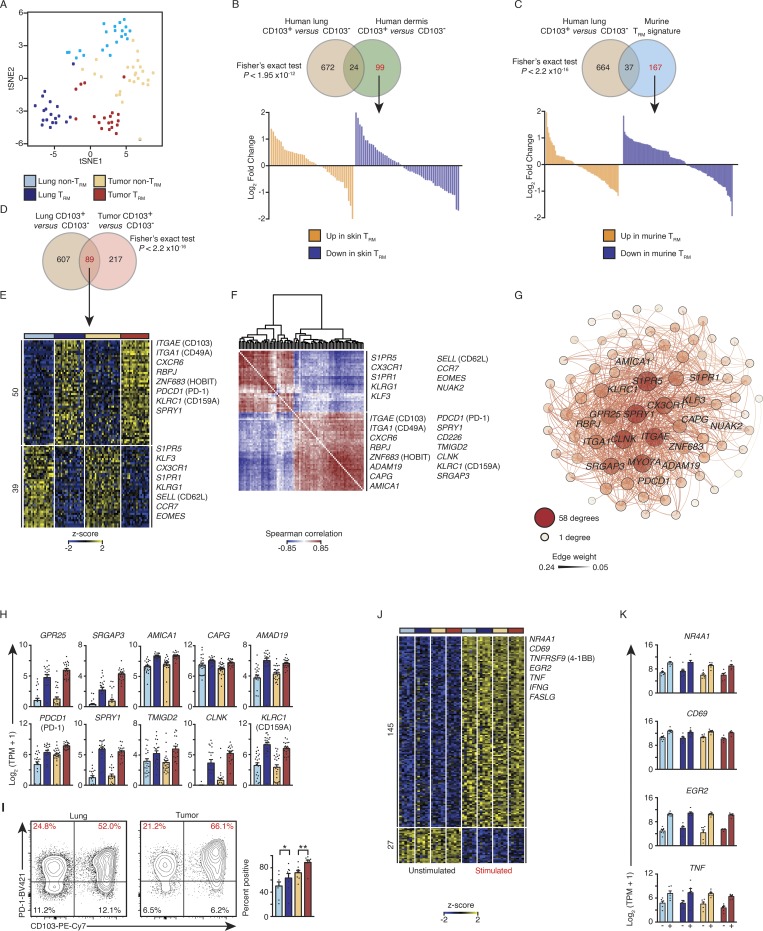
Figure 1.
PD-1 expression is a feature of lung and tumor TRM cells. (A) tSNE plot of tumor and lung CTL transcriptomes segregated by CD103 expression (lung non-TRM = 21, lung TRM = 20, tumor non-TRM = 25, and tumor TRM = 19). (B and C) Top: Venn diagrams showing overlap of transcripts differentially expressed in lung TRM versus other previously characterized TRM cells. Bottom: Waterfall plots represent the DESeq2 normalized fold change from the human lung comparison of genes not significantly (change twofold or less, with an adjusted P value of >0.05) differentially expressed between lung TRM (CD103+) and non-TRM (CD103−) CTLs (marked in red font in the Venn diagram). (D and E) Venn diagram (D) and heat map (E) of RNA-seq analysis of 89 common transcripts (one per row) expressed differentially by lung TRM versus lung non-TRM and tumor TRM versus tumor non-TRM (pairwise comparison; change in expression of twofold with an adjusted P value of ≤0.05 [DESeq2 analysis; Benjamini–Hochberg test]), presented as row-wise z-scores of TPM counts; each column represents an individual sample; known TRM or non-TRM transcripts are indicated. The color scheme and number of samples are identical to A. (F) Spearman coexpression analysis of the 89 differentially expressed genes as in D and E; values are clustered with complete linkage. (G) WGCNA visualized in Gephi, the nodes are colored and sized according to the number of edges (connections), and the edge thickness is proportional to the edge weight (strength of the correlation). (H) Expression values according to RNA-seq data of the indicated differentially expressed genes shared by lung and tumor TRM cells. Each symbol represents an individual sample, the bar represents the mean (colored as in A), and t-lines represents SEM. (I) Flow cytometry analysis of the expression of PD-1 versus that of CD103 on live and singlet-gated CD14−CD19−CD20−CD56−CD4−CD45+CD3+CD8+ cells obtained from lung cancer CTLs and matched paired lung CTLs. Right: Frequency of cell that express PD-1 in the indicated populations (*, P ≤ 0.05; **, P ≤ 0.01; n = 8; Wilcoxon rank-sum test); each symbol represents a sample, bars represent the mean, and t-lines represent SEM, colored as per A. (J) RNA-seq analysis of genes (row) commonly up- or down-regulated in the four cell types following 4 h of ex vivo stimulation; heat map as in E. (K) Bar graphs showing expression of transcripts in the indicated populations (n = 6 for all comparisons; as per J); left bar is ex vivo (−), and right bar is the expression profile following stimulation (+).

