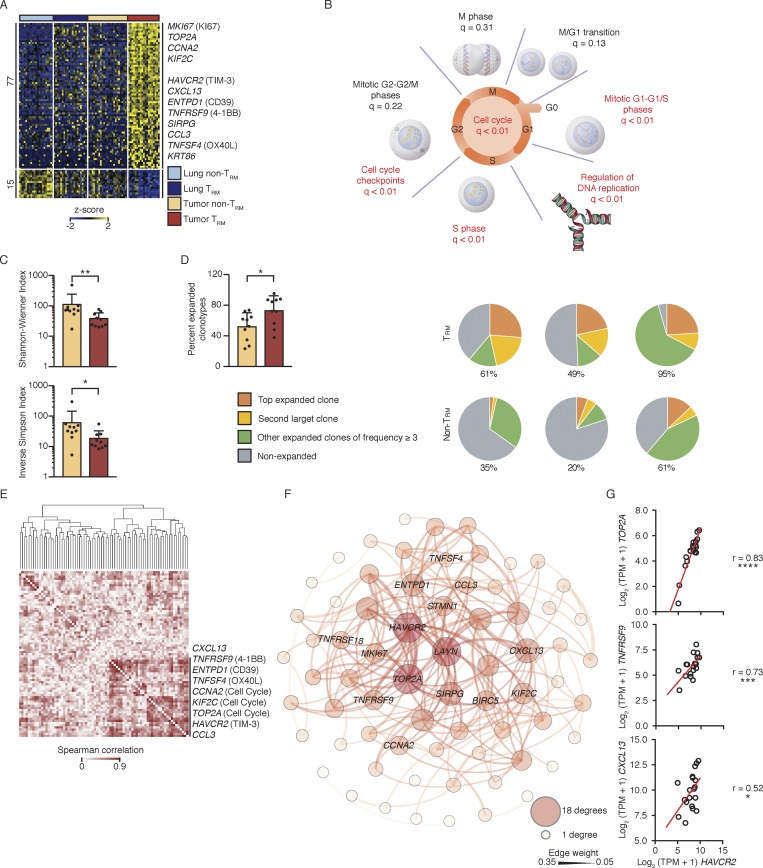
Figure 2.
Tumor TRM cells were clonally expanded. (A) RNA-seq analysis of transcripts (one per row) differentially expressed by tumor TRM relative to lung TRM, lung non-TRM, and tumor non-TRM (pairwise comparison; change in expression of twofold with an adjusted P value of ≤0.05 [DESeq2 analysis; Benjamini–Hochberg test]), presented as row-wise z-scores of TPM counts; each column represents an individual sample (lung non-TRM = 21, lung TRM = 20, tumor non-TRM = 25, and tumor TRM = 19). (B) Summary of overrepresentation analysis (using Reactome) of genes involved in the cell cycle that are differentially expressed by lung tumor TRM cells relative to the other lung CTLs; q values represent FDR. (C) Shannon–Wiener diversity and inverse Simpson indices obtained using V(D)J tools following TCR-seq analysis of β chains in tumor TRM and tumor non-TRM populations. Bars represent the mean, t-lines represent SEM, and symbols represent individual data points (*, P ≤ 0.05; **, P ≤ 0.01; n = 10 patients; Wilcoxon rank-sum test). (D) Left: Bar graphs show the percentage of total TCRβ chains that were expanded (≥3 clonotypes). Bars represent the mean, t-lines represent SEM, and dots represent individual data points (*, P ≤ 0.05; n = 10 patients). Right: Pie charts show the distribution of TCRβ clonotypes based on clonal frequency. (E) Spearman coexpression analysis of the 77 genes up-regulated (A) in tumor TRM cells; values are clustered with complete linkage. (F) WGCNA visualized in Gephi; the nodes are colored and sized according to the number of edges (connections), and the edge thickness is proportional to the edge weight (strength of correlation). (G) Correlation of the expression of HAVCR2 (TIM-3) transcripts and the indicated transcripts in the tumor TRM population; r indicates Spearman correlation value (*, P ≤ 0.05; ***, P ≤ 0.001; ****, P ≤ 0.0001; n = 19 patients).

