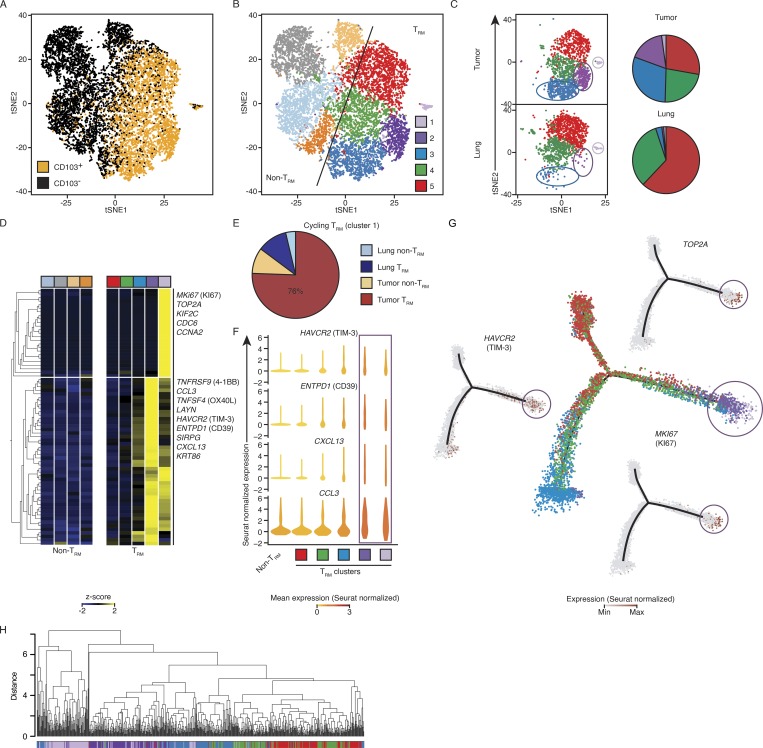
Figure 3.
Single-cell transcriptomic analysis reveals previously uncharacterized TRM subsets. (A) tSNE visualization of ∼12,000 live and singlet-gated CD14−CD19−CD20−CD4−CD56−CD45+CD3+CD8+ single-cell transcriptomes obtained from 12 tumors and 6 matched normal lung samples. Each symbol represents a cell; color indicates protein expression of CD103 detected by flow cytometry. (B) Seurat clustering of cells in A, identifying nine clusters. (C) Cells from tumor and lung were randomly down-sampled to equivalent numbers of cells. Left: Distribution of TRM-enriched clusters in tumor and lung. Right: Pie chart representing the relative proportions of cells in each TRM cluster. (D) Expression of transcripts previously identified as up-regulated in the bulk tumor TRM population (Fig. 2 A) by each cluster; each column represents the average expression in a particular cluster. (E) Breakdown of cell type and tissue localization of cells defined as being in cluster 1 (shown in light purple in B and D). (F) Violin plots of expression of example tumor TRM genes in each TRM-enriched cluster (square below indicates the cluster type) and non-TRM cells; shape represents the distribution of expression among cells and color represents the Seurat-normalized average expression counts. (G) Cell-state hierarchy maps generated by Monocle2 bioinformatic modeling of the TRM clusters. In the center plot, each dot represents a cell colored according to Seurat-assigned cluster. Surrounding panels show relative Seurat-normalized expression of the indicated genes. (H) Cluster analysis of the location in PCA space for cells. Each cluster was randomly down sampled to the equivalent size of the smallest cluster (n = 135 cells per cluster, 675 total). The correlation method was Spearman, and the dataset was clustered with average linkage.

