Figure 4.
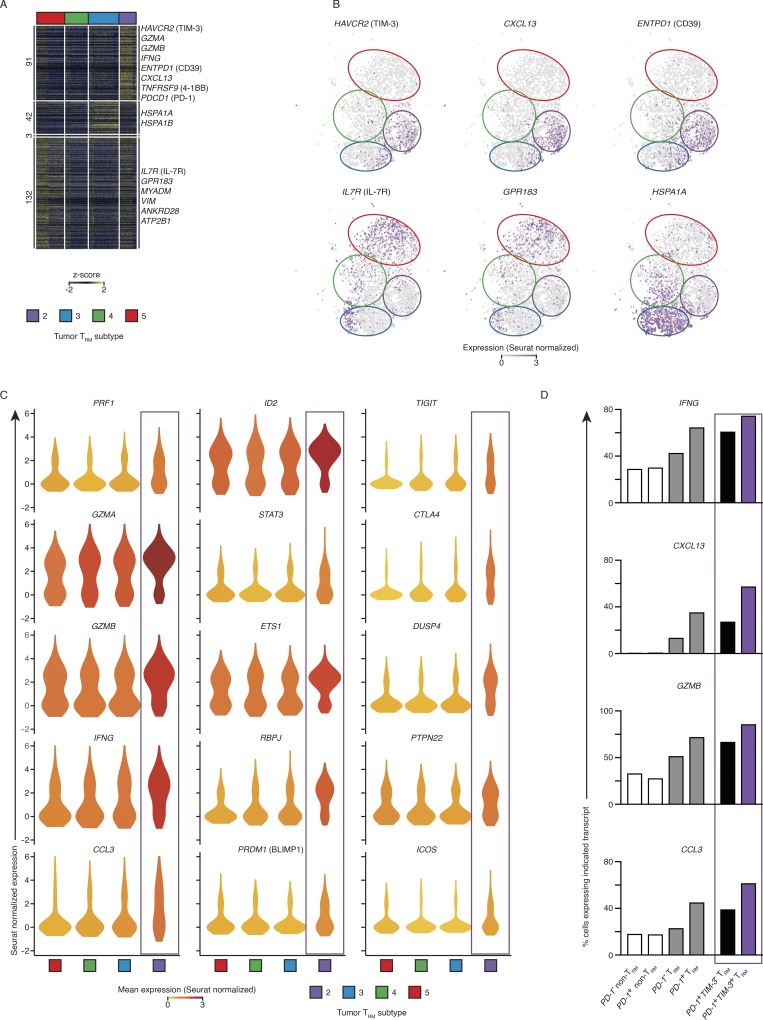
The TIM-3+IL7R− TRM subset was enriched for transcripts linked to cytotoxicity. (A) Single-cell RNA-seq analysis of transcripts (one per row) uniquely differentially expressed by each tumor TRM subset in pairwise analysis compared with other clusters (adjusted P value of ≤0.01; MAST analysis), presented as row-wise z-scores of Seurat-normalized count; each column represents an individual cell. Horizontal breaks separate genes enriched in each of the four tumor TRM subsets. (B) Seurat-normalized expression of indicated transcripts identified as differentially enriched in each cluster (as per A), overlaid across the tSNE plot, with expression levels represented by the color scale. (C) Violin plot of expression of functionally important genes identified as significantly enriched in a tumor TRM subset; shape represents the distribution of expression among cells and color represents the Seurat-normalized average expression (cluster identification as per A). (D) Percentage of cells expressing the indicated transcripts in each population, where positive expression was defined as >1 Seurat-normalized count; “TRM” corresponds to tumor-infiltrating CTLs isolated from clusters 2, 3, 4, and 5, and “non-TRM” corresponds to to the remaining cells not assigned into the proliferating TRM cluster 1.

