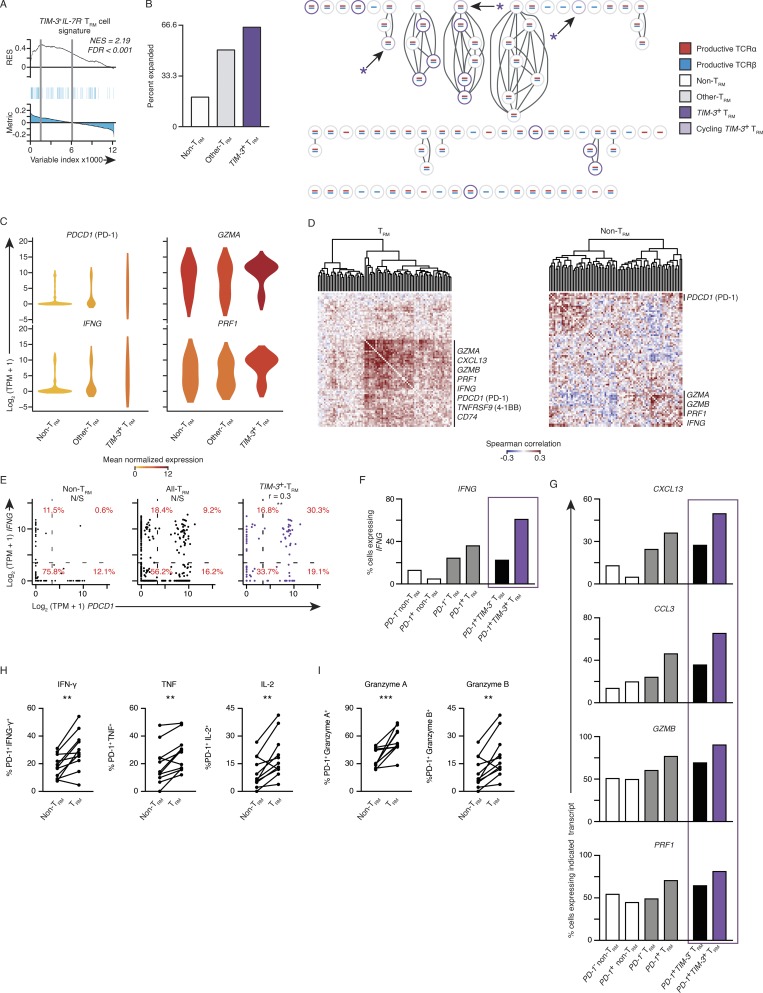
Figure 5.
PD-1– and TIM-3–expressing tumor-infiltrating TRM cells are not exhausted. (A) GSEA of the TIM-3+IL7R− TRM subset signature in the transcriptome of clonally expanded tumor TRM versus that of nonexpanded TRM cells. Top: Running enrichment score (RES) for the gene set, from most enriched at the left to most underrepresented at the right. Middle: Positions of gene set members (blue vertical lines) in the ranked list of genes. Bottom: Value of the ranking metric. Values above the plot represent the normalized enrichment score (NES) and FDR-corrected significance. (B) Left: Percentage of cells that were clonally expanded in TIM-3+ (HAVCR2 ≥10 TPM counts) TRM cells, remaining TRM cells, and non-TRM cells; clonal expansion was determined for cells from four and two patients for TRM and non-TRM, respectively. Right: Section of a clonotype network graph of cells from a representative patient. TIM-3+ (HAVCR2 ≥10 TPM counts) TRM cells are marked with a purple circle; cells with >10 TPM counts expression of either MKI67 or TOP2A were considered cycling and denoted with an asterisk. (C) Violin plot of expression of indicated transcripts; shape represents the distribution of expression among cells and color represents average expression, calculated from the TPM counts (color coded as per B). (D) Spearman coexpression analysis of genes whose expression is enriched in the TIM-3+IL7R− TRM cluster (Fig. 4 A) in tumor TRM and non-TRM populations, respectively; matrix is clustered according to complete linkage. (E) Correlation of PDCD1 and IFNG expression in non-TRM cells, all TRM cells, and then in TIM-3+ TRM; each dot represents a cell. Percentages indicate the percentage of cells inside each of the graph sections (r indicates Spearman correlation value; **, P ≤ 0.01; N/S, no significance). (F) Percentage of cells expressing IFNG in each indicated population segregated on PD-1+ (PDCD1 ≥ 10 TPM counts). The final two bars are the TRM population, as segregated by having expression of HAVCR2 (TIM-3) ≥ 10 TPM counts. (G) Percentage of cells expressing the indicated transcript as identified above the plot in each population (as per F). (H) Flow cytometry analysis of the percentage of PD-1+ TRM and PD-1+ non-TRM cells that express effector cytokines (as indicated above the graph) following 4 h of ex vivo stimulation. Gated on live and singlet-gated CD14−CD20−CD4−CD45+CD3+CD8+ cells obtained from lung cancer TILs, discriminated on CD103 expression (**, P ≤ 0.01; n = 11; Wilcoxon rank-sum test); each symbol represents a sample. Surface molecules (e.g., PD-1) were stained before stimulation. (I) Analysis of granzyme A and granzyme B directly ex vivo, gated and analyzed as per H (***, P ≤ 0.001; Wilcoxon rank-sum test).

