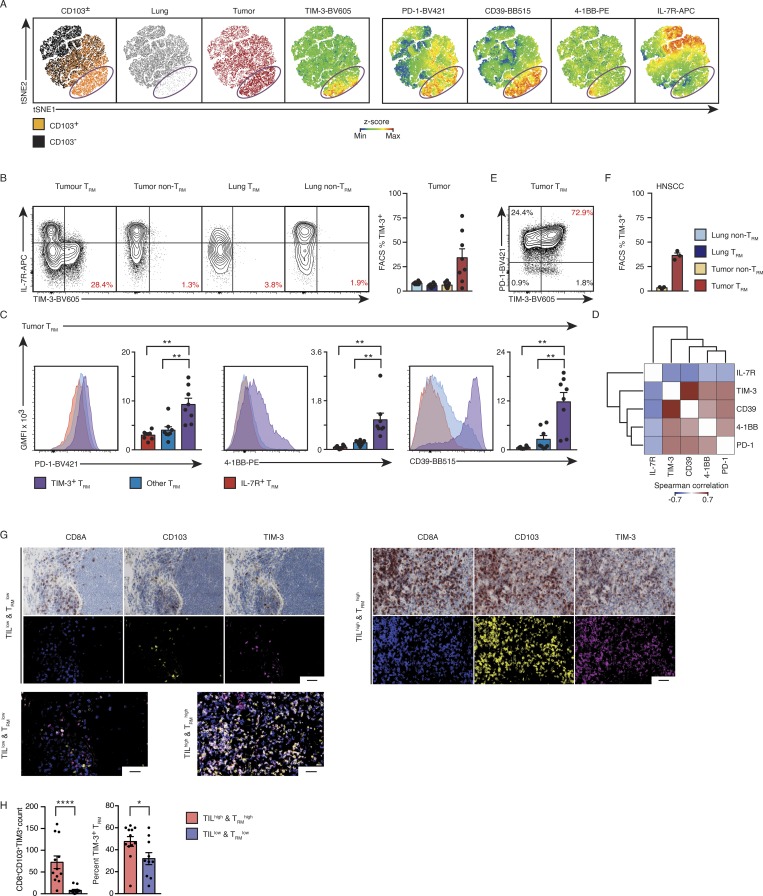
Figure 6.
Surface TIM-3+IL-7R− status uniquely characterizes a set of tumor TRM cells. (A) tSNE visualization of flow cytometry data from 3,000 randomly selected live and singlet-gated CD14−CD19−CD20−CD56−CD4−CD45+CD3+CD8+ cells isolated from eight paired tumor and lung samples; each cell is represented by a dot colored as TRM or non-TRM (left), tumor or lung (second and third from left), and according to z-score expression value of the protein indicated above the plot (remaining panels). (B) Left: Contour plots show the expression of TIM-3 versus IL-7R in the cell type and tissue indicated above the plot; percentage of tumor CTLs (gated as above) in the indicated populations that express TIM-3 is shown. Right: Quantification of TIM-3+ in cells isolated from each tissue location; each symbol represents an individual sample. The small line indicates SEM, and bars represent the mean and are colored as indicated (*, P ≤ 0.05; n = 8, 3). (C) Geometric mean fluorescent intensity (GMFI) of CD39, PD-1, and 4-1BB for each lung tumor-TRM subset; bars represent the mean, t-lines represent SEM, and each symbol represents data from individual samples (**, P ≤ 0.01; n = 8; Wilcoxon rank-sum test); representative histograms are shown at left. (D) Coexpression analysis of flow cytometry data (C), as per Spearman correlation. (E) Contour plot highlighting the expression of PD-1 versus TIM-3 in CD14−CD19−CD20−CD56−CD4−CD45+CD3+CD8+CD103+ cells in a representative donor. (F) Analysis of three HNSCC samples, as per B. (G) Left: Representative multiplexed immunohistochemistry of CD8A, CD103, and TIM-3 in tumor specimens from a patient with TILlow/TRMlow tumor status; the representative false color image (middle) and the overlaid image (bottom) are shown. Right: As the left plots for a patient with TILhigh/TRMhigh tumor status (scale bar, 50 µm). (H) Left: Quantification of the number of CD8A+CD103+TIM-3+ cells per region in biopsies defined as having a TILhigh/TRMhigh status versus TILlow/TRMlow status. Right: Percentage of CD8A+CD103+ CTLs expressing TIM-3 in each clinical subtype. Bars represent the mean, t-lines represent SEM, and symbols represent individual data points (*, P ≤ 0.05; ****, P ≤ 0.0001; n = 21; Mann–Whitney U test).

