Figure 7.
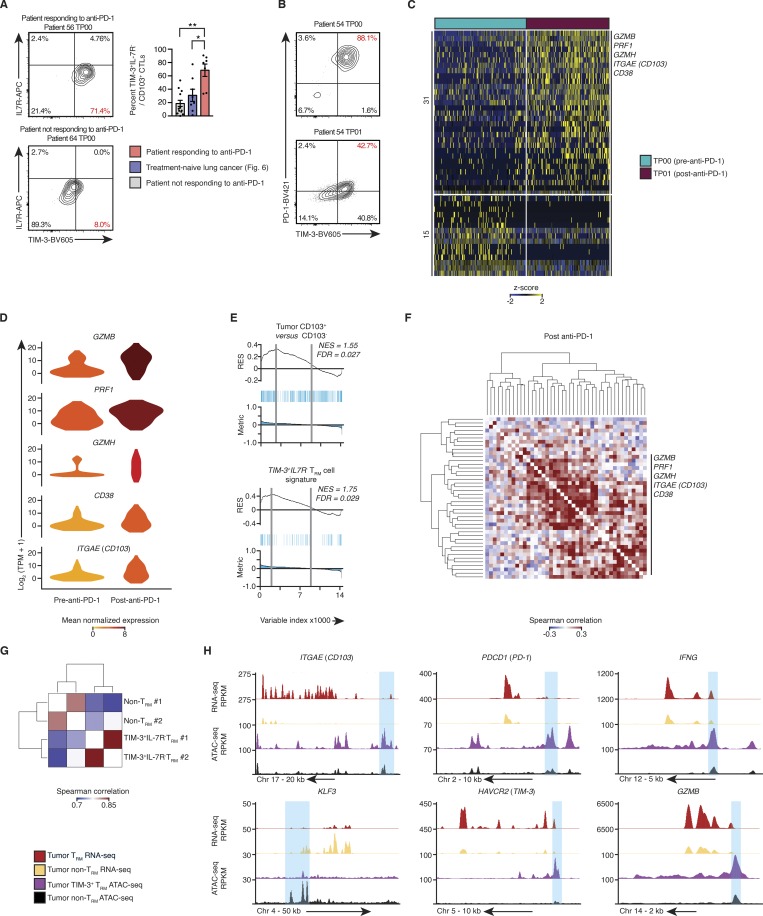
Single-cell transcriptome analysis of CTLs from anti-PD-1 responders. (A) Left: Contour plots show the expression of TIM-3 and IL-7R in CD14−CD19−CD20−CD4−CD45+CD3+CD8+CD103+ cells isolated from patients receiving anti-PD-1 treatment at the time point (TP) indicated above the plot; number in red indicates the percentage of tumor TRM cells (CD8+CD103+) with TIM-3+IL-7R− surface phenotype. Right: Quantification of the percentage of tumor-infiltrating TIM-3+IL-7R− TRM cells, isolated from the anti-PD-1 responding, nonresponding, and treatment-naive patients. Bars represent the mean, t-lines represents SEM, and symbols represent individual data points (*, P ≤ 0.05; **, P ≤ 0.01; n = 7, 8, and 12 biopsies for responders, treatment-naive patients, and nonresponders, respectively; Mann–Whitney U test). (B) Contour plots demonstrate the expression of TIM-3 and PD-1 in the TRM cells isolated from preimmunotherapy biopsies (gated as per Fig. 7 A). (C) Single-cell RNA-seq analysis of transcripts (one per row) differentially expressed between CTLs pre– and post–anti-PD-1 (MAST analysis), with an adjusted P value of ≤0.05), presented as row-wise z-scores of TPM counts; each column represents a single cell (n = 127 and 151 cells, respectively). (D) Violin plot of expression of indicated transcripts differentially expressed between tumor-infiltrating CTLs isolated from pre– and post–anti-PD-1 treatment samples (as per C); shape represents the distribution of expression among cells, and color represents average expression, calculated from the TPM counts. (E) GSEA of the bulk tumor CD103+ versus CD103− transcriptional signature (Fig. 2 A) and TIM-3+IL7R− TRM cell signature (Fig. 4 A) in tumor-infiltrating CTLs isolated from pre– and post–anti-PD-1 treatment samples. Top: RES for the gene set, from most enriched at the left to most underrepresented at the right. Middle: Positions of gene set members (blue vertical lines) in the ranked list of genes. Bottom: Value of the ranking metric. Values above the plot represent the NES and FDR-corrected significance. (F) Spearman coexpression analysis of transcripts enriched in tumor-infiltrating CTLs from post–anti-PD-1 treatment samples (C); matrix is clustered according to complete linkage. (G) Correlation analysis of all peaks identified in the OMNI-ATAC-seq libraries, pooled from nine donors across two experiments; cells were sorted on CD14−CD19−CD20−CD4−CD45+CD3+CD8+CD103+TIM-3+IL-7R− and CD14−CD19−CD20−CD4−CD45+CD3+CD8+CD103−. The matrix is clustered according to complete linkage. (H) University of California Santa Cruz genome browser tracks for key TRM-associated gene loci as indicated above the tracks. RNA-seq tracks are merged from all purified bulk RNA-seq data, presented as reads per kilobase million (RPKM; as per Fig. 1 A; tumor non-TRM = 25, tumor TRM = 19; OMNI-ATAC-seq as per Fig. 7 G).

