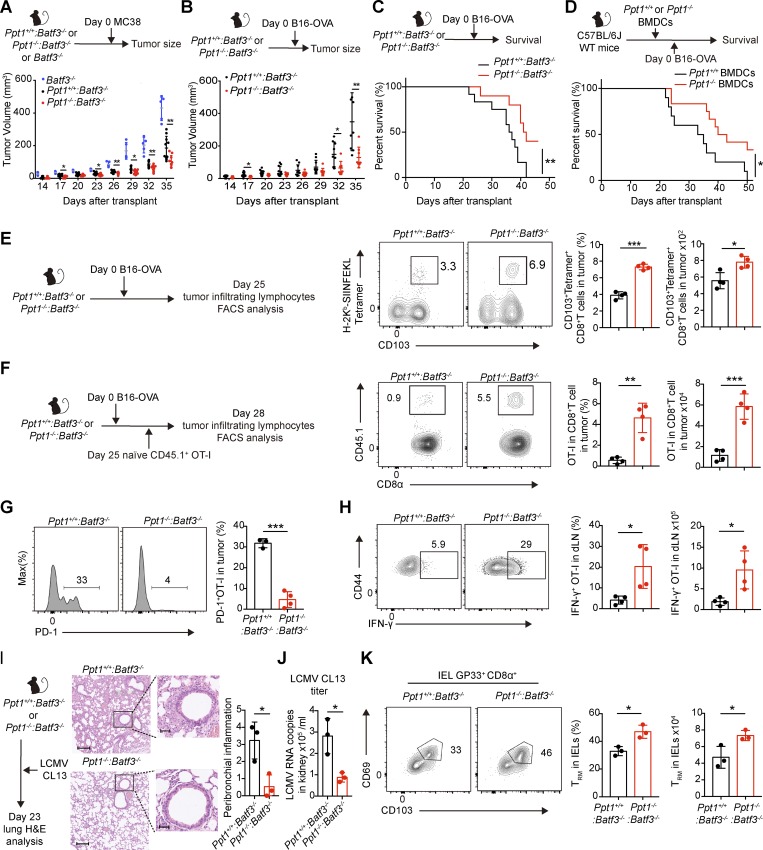
Figure 2.
PPT1-deficient cDC1s enhance antitumor immune response. (A) MC38 tumor growth curve. Batf3−/− mice, Ppt1+/+:Batf3−/−, or Ppt1−/−:Batf3−/− chimeras were transplanted with MC38. Data are representative of one of three independent experiments (Batf3−/−, n = 5 mice; Ppt1+/+:Batf3−/− or Ppt1−/−:Batf3−/−, n = 10 mice). (B) B16-OVA tumor growth curve. Ppt1+/+:Batf3−/− or Ppt1−/−:Batf3−/− chimeras were transplanted with B16-OVA. Data are representative of one of three independent experiments (Ppt1+/+:Batf3−/−, n = 12 mice; Ppt1−/−:Batf3−/−, n = 9 mice). (C) B16-OVA survival curve of chimeras. Ppt1+/+:Batf3−/− or Ppt1−/−:Batf3−/− chimeras were transplanted with B16-OVA. Data are representative of one of three independent experiments (Ppt1+/+:Batf3−/−, n = 12 mice; Ppt1−/−:Batf3−/−, n = 9 mice). (D) B16-OVA survival curve of WT mice receiving BMDCs from chimeras. WT mice received Ppt1+/+ or Ppt1−/− BMDCs from chimeras, and then were transplanted with B16-OVA. Data are representative of one of three independent experiments (Ppt1+/+, n = 10 mice; Ppt1−/−, n = 12 mice). (E) Tumor-infiltrating antigen-specific CD8+ T cells. Ppt1+/+:Batf3−/− or Ppt1−/−:Batf3−/− chimeras were transplanted with B16-OVA, and tumor-infiltrating lymphocytes (gated on live CD8α+ CD44+ B220− cells) from solid tumors were analyzed at day 25 by FACS. Percentages (left) and cell numbers (right) are shown. Data are representative of one of two independent experiments (n = 4 mice per group). (F) Tumor-infiltrating OT-I cells. Tumor-infiltrating lymphocytes (gated on live CD8α+CD44+ cells) were analyzed by FACS in solid tumors from Ppt1+/+:Batf3−/− or Ppt1−/−:Batf3−/− chimeras with B16-OVA xenograft. Percentages (left) and cell numbers (right) are shown. Data are representative of one of two independent experiments (n = 4 mice per group). (G) PD-1 expression on tumor-infiltrating OT-I cells. OT-I cells (gated on live CD8α+ CD44+ CD45.1.2+ cells) were analyzed in solid tumors from Ppt1+/+:Batf3−/− or Ppt1−/−:Batf3−/− chimeras with B16-OVA xenograft. Histogram (left) and MFI (right) are shown. Data are representative of one of two independent experiments (n = 4 mice per group). (H) IFN-γ production of OT-I cells in tumor-draining lymph node (dLN). Tumor-draining lymph node cells (gated on live CD8α+ CD44+ cells) from Ppt1+/+:Batf3−/− or Ppt1−/−:Batf3−/− chimeras with B16-OVA xenograft were stimulated with SIINFEKL. Representative FACS plot (left), percentages (center), and cell numbers (right) are shown. Data are representative of one of two independent experiments (n = 4 mice per group). (I) Representative H&E lung section (left) and semiqualitative score of peribronchial inflammation (right). Ppt1−/−:Batf3−/− chimeras were infected with LMCV CL 13 and analyzed at day 23. Bars, 200 µm (left) or 50 µm (right). Data are representative of one of two independent experiments (n = 3 mice per group). (J) Viral load in kidney. LCMV CL 13 viral mRNA in kidney tissue extracts were measured by qPCR. Data are combined results of three independent experiments (n = relative values from three independent runs). (K) Intraepithelial antigen-specific resident memory T cells. Intraepithelial lymphocytes (gated on live CD8α+ CD44+ GP33+ B220− cells) were analyzed by FACS. Representative FACS plot (left), percentages (center), and cell numbers (right) are shown. Data are representative of one of two independent experiments (n = 3 mice per group). All data are shown as mean ± SD, and P values were calculated by two-way Student’s t test (*, P < 0.05; **, P < 0.01; ***, P < 0.001). IEL, intraepithelial lymphocyte.

