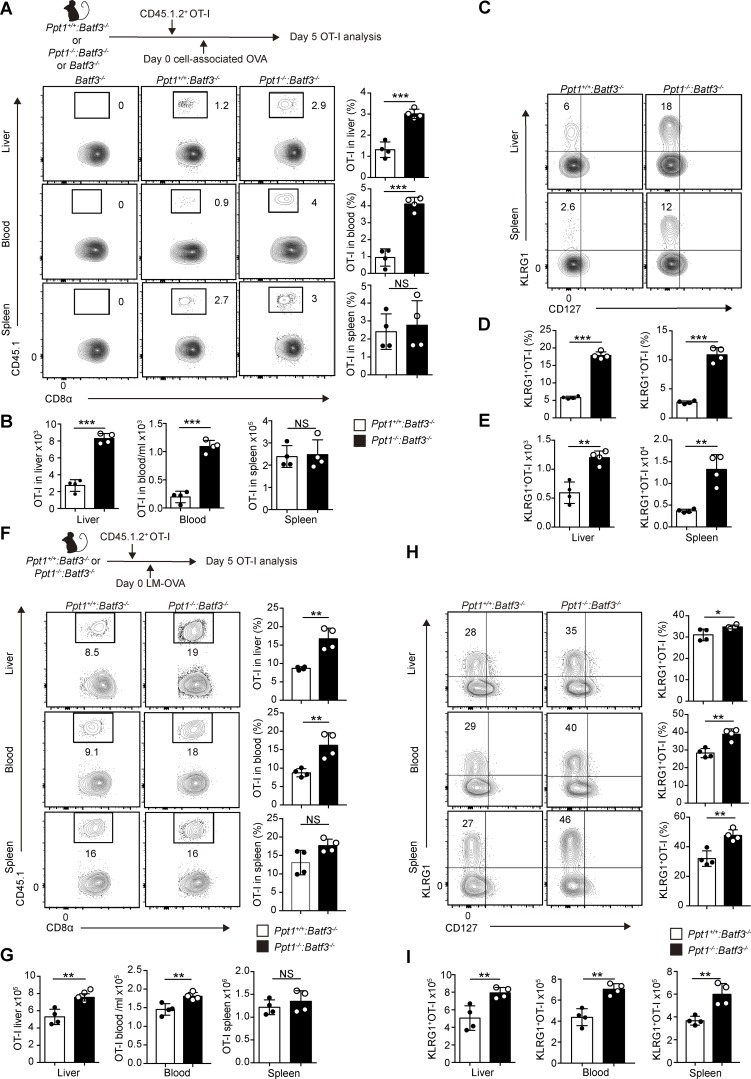
Figure 4.
PPT1-deficient cDC1s preferentially crossprime naive CD8+ T cells into KLRG1+ effectors at nonlymphoid tissue. (A and B) Tissue distribution of crossprimed OT-I cells. CD8+ T cells (gated on live CD8α+ CD44+) were analyzed from indicated organs from Ppt1+/+:Batf3−/− or Ppt1−/−:Batf3−/− chimeras. Representative FACS plots (A, left) of liver (top), blood (center), and spleen (bottom); percentages (A, right); and cell numbers (B) are shown. Data are representative of one of five independent experiments (n = 4 mice per group). (C–E) Distribution of crossprimed OT-I effector subsets. OT-I cells (gated on live CD8α+ CD44+ CD45.1.2+ cells) were analyzed from Ppt1+/+:Batf3−/− or Ppt1−/−:Batf3−/− chimeras in indicated organs. Representative FACS plot (C) of liver (top) and spleen (bottom), percentages (D), and cell numbers (E) are shown. Data are representative of one of five independent experiments (n = 4 mice per group). (F and G) Tissue distribution of OT-I cells during infection. Representative FACS plots (F, left) of liver (top), blood (center), and spleen (bottom); percentages (F, right); and cell numbers (G) are shown. Data are representative of one of five independent experiments (n = 4 mice per group). (H and I) Distribution of OT-I effector subsets during infection. OT-I (gated on live CD8α+ CD44+ CD45.1.2+ cells) effector subsets from Ppt1+/+:Batf3−/− or Ppt1−/−:Batf3−/− chimeras were analyzed in the indicated organs. Representative FACS plots (H, left) of liver (top), blood (center), and spleen (bottom); percentages (H, right); and cell numbers (I) are shown. Data are representative of one of five independent experiments (n = 4 mice per group). All data are shown as mean ± SD, and P values were calculated by two-way Student’s t test (*, P < 0.05; **, P < 0.01; ***, P < 0.001).

