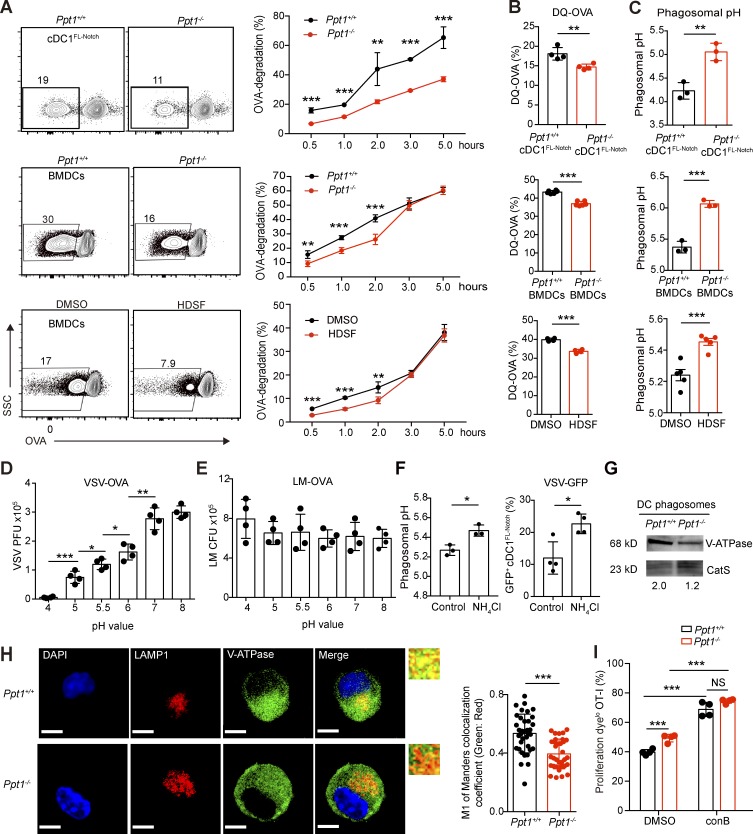
Figure 5.
PPT1 promotes antigen degradation and phagosomal acidification in DCs. (A) Antigen degradation in DC phagosomes. DCs were fed OVA-associated beads for indicated times. After lysis, the supernatants containing the latex beads were collected and stained with anti-OVA antibodies. Representative FACS plots at 1 h (left) of cDC1FL-Notch (top), BMDCs (center), DMSO- or HDSF-treated BMDCs (bottom), and time course (right) are shown. Data are representative of one of three independent experiments (n = 5 mice per group). (B) DQ-OVA release in DC phagosomes. BMDCs were fed DQ-OVA for 1 h. MFI of DQ-OVA in Ppt1+/+ or Ppt1−/− cDC1FL-Notch (top), BMDCs (center), and DMSO- or HDSF-treated BMDCs (bottom) are shown. Data are representative of one of three independent experiments (cDC1FL-Notch, n = 4 mice; BMDCs, n = 6 mice; DMSO or HDSF, n = 4 mice). (C) DC phagosomal pH. DCs were fed AF488 OVA and pHrodo-OVA for 1 h, and the pH value was calculated according to a pH standard curve based on flow cytometry data. cDC1FL-Notch (top), BMDCs (center), and DMSO- or HDSF-treated BMDCs (bottom) are shown. Data are representative of one of three independent experiments (cDC1FL-Notch, n = 4 mice; BMDCs, n = 6 mice; DMSO or HDSF, n = 4 mice). (D and E) Effect of acidic pH on pathogen’s infectivity. VSV-OVA (D) or LM-OVA (E) were treated with the indicated pH buffers for 30 min, quenched at pH 7.4, and then evaluated for PFU or CFU. Data are representative of one of two independent experiments (n = 4 technical replicates). (F) Effect of endosomal alkalization on VSV infection rate of cDC1s. NH4Cl was used to increase endosomal pH on WT cDC1FL-Notch (left), and VSV-GFP+ cells with ddH2O (control) or NH4Cl treatment are shown (right). Data are representative of one of two independent experiments (n = 4 technical replicates). (G) V-ATPase V1a protein expression in purified DC phagosomes. V-ATPase level was measured by Western blotting from purified BMDC phagosomes. CatS is used as loading control. Gray area ratio of vATPase over CatS is shown below. Data are representative of one of two independent experiments (sample from three pooled mice). (H) V-ATPase V1a distribution on LAMP1+ endosomes. Confocal microscopy was performed using Ppt1+/+ or Ppt1−/− BMDCs from chimeras with the indicated antibodies, and representative images (I) and the colocalization coefficient of LAMP1 and V-ATPase (right) are shown. Bars, 5 µm (all panels). Data are representative of one of six independent experiments (n = 35 cell images counted randomly per group). (I) Inhibition of crosspriming by V-ATPase inhibitor conB. DMSO or ConB was added along with OVA-associated beads to Ppt1+/+ or Ppt1−/− BMDCs. The percentages of Cell Proliferation Dyelo CD44+ OT-I cells are shown. Data are representative of one of two independent experiments (n = 4 mice per group). All data are shown as mean ± SD, and P values were calculated by two-way Student’s t test (*, P < 0.05; **, P < 0.01; ***, P < 0.001).

