Figure 6.
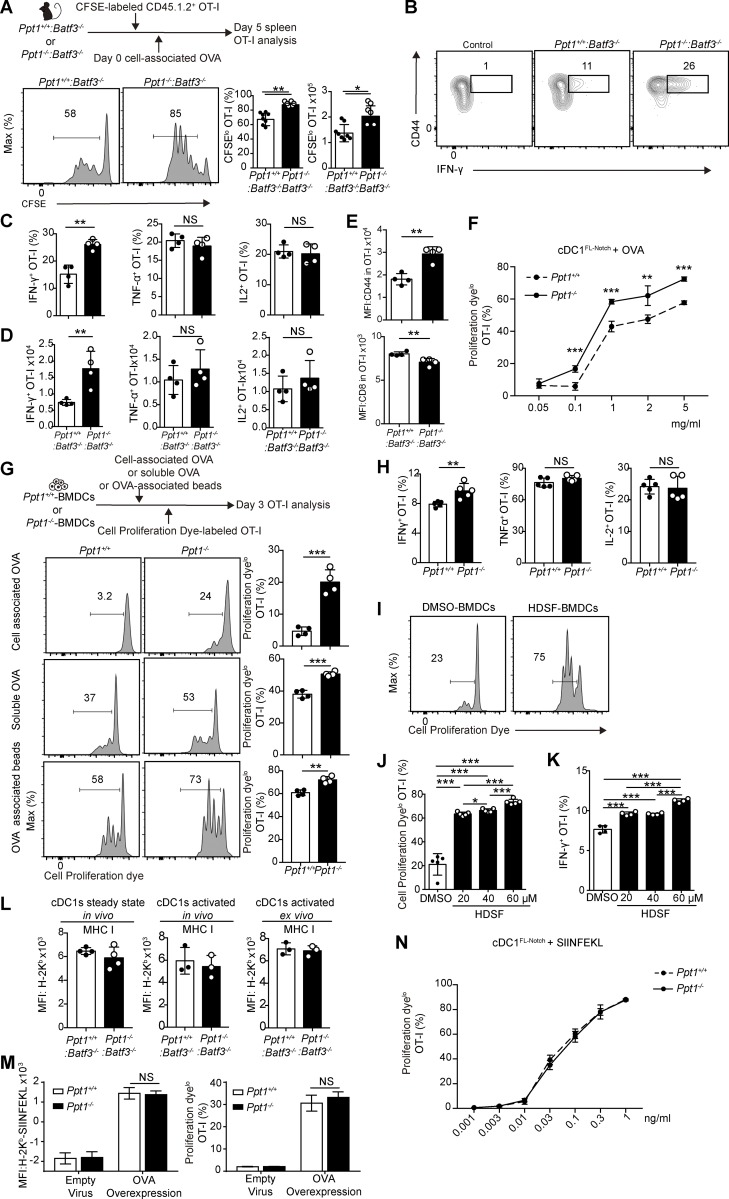
PPT1 suppresses antigen cross-presentation in vivo and in vitro. (A) Splenic OT-I proliferation measured by CFSE. Ppt1+/+:Batf3−/− or Ppt1−/−:Batf3−/− chimeras were injected with CFSE-labeled CD45.1.2+ OT-I T cells and then injected with cell-associated OVA the next day. Mice were analyzed 5 d later. Representative FACS plot (left, gated on live CD8α+ CD44+ CD45.1.2+), CFSElo percentages (center), and cell numbers (right) are shown. Data are representative of one of five independent experiments (n = 4 mice per group). (B–D) Cytokine production of splenic OT-I cells. Representative FACS plots (B, gated on live CD8α+ CD45.1.2+ cells) are shown. Percentages (C, IFN-γ, left; TNF-α, center; and IL-2, right) and cell numbers (D) are shown. Data are representative of one of five independent experiments (n = 4 mice per group). (E) Expression of activation markers on splenic OT-I cells. MFI of CD44 (top) and CD8α (bottom) are shown. Data are representative of one of five independent experiments (n = 4 mice per group). (F) Crosspriming by cDC1FL-Notch. Ppt1+/+, or Ppt1−/− cDC1FL-Notch from chimeras were fed with indicated OVA concentrations, and OT-I proliferation was measured by Proliferation dye. Data are representative of one of two independent experiments (n = 3 mice per group). (G) Crosspriming by BMDCs. Ppt1+/+ or Ppt1−/− BMDCs from chimeras were fed the indicated exogenous antigens. Representative FACS plot (left, gated on live CD8α+ CD45.1+) of Tap1−/− cell–associated OVA (top), soluble OVA (center), or OVA-associated beads (bottom). Percentages of Cell Proliferation Dyelo CD44+ OT-I cells (right) are shown. Data are representative of one of three independent experiments (n = 4 mice per group). (H) Cytokine production of crossprimed OT-I cells. Ppt1+/+ or Ppt1−/− BMDCs from chimeras were fed with Tap1−/− cell–associated OVA. Percentages of cytokine-producing OT-I cells (IFN-γ, left; TNF-α, center; and IL-2, right) are shown. Data are representative of one of three independent experiments (n = 4 mice per group). (I and J) OT-I proliferation measured by Cell Proliferation Dye. DMSO or HSDF-treated WT BMDCs were fed with Tap1−/− cell–associated OVA. Representative FACS plot (I) and Cell Proliferation Dyelo OT-I cell percentages (J) are shown. Data are representative of one of three independent experiments (n = 4 mice per group). (K) IFN-γ production by OT-I cells. DMSO- or HSDF-treated WT BMDCs were fed with Tap1−/− cell–associated OVA, and OT-I cells were stimulated with SIINFEKL. Data are representative of one of three independent experiments (n = 5 mice per group). (L) MHC class I expression on cDC1s. H2-Kb expression was measured by FACS on naive splenic cDC1s (left), during LM-OVA infection (center), and LPS-activated (right) cDC1s from Ppt1+/+:Batf3−/− or Ppt1−/−:Batf3−/− chimeras. Data are representative of one of two independent experiments (n = 3 mice). (M) Effect of PPT1 on endogenous MHC class I presentation. WT BMDCs were transduced with empty or OVA-expressing retroviruses and then incubated with OT-I cells. MFI of H-2Kb-SIINFEKL (25.D1.16, left) and OT-I proliferation (right) are shown (n = 3 technical replicates). Data are representative of one of two independent experiments. (N) Direct MHC I antigen presentation by cDC1FL-Notch. Ppt1+/+, or Ppt1−/− cDC1FL-Notch from chimeras were pulsed with indicated concentrations of SIINFEKL and then incubated with CFSE-labeled CD45.1.2+ OT-I cells. Data are representative of one of two independent experiments (n = 3 mice per group). All data are shown as mean ± SD, and P values were calculated by two-way Student’s t test (*, P < 0.05; **, P < 0.01; ***, P < 0.001).

