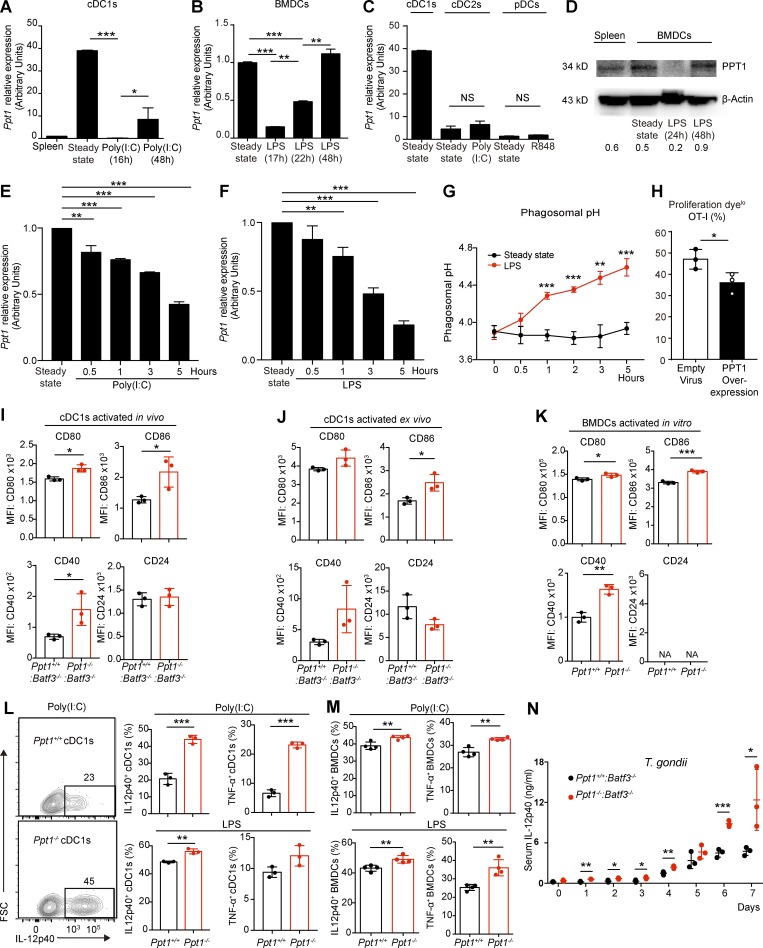
Figure 7.
Rapid down-regulation of PPT1 in activated cDC1s facilitates efficient crosspriming. (A) Ppt1 mRNA expression in activated cDC1s. FACS sorted WT cDC1s were stimulated with poly(I:C), and Ppt1 transcript was measured by qPCR. Data are combined results of three independent experiments (n = relative values from three independent runs). (B) Ppt1 mRNA expression in activated BMDCs. WT BMDCs were stimulated with LPS, and Ppt1 transcript was measured by qPCR. Data are combined results of three independent experiments (n = relative values from three independent runs). (C) Ppt1 mRNA expression in other activated DCs. Indicated FACS-sorted WT populations were stimulated, and Ppt1 transcript was measured by qPCR. Data are combined results of three independent experiments (n = relative values from three independent runs). (D) PPT1 protein expression in activated BMDCs. WT BMDCs were stimulated with LPS, and PPT1 expression was measured by Western blotting. β-Actin was used as loading control. Gray area ratio of PPT1 over β-actin is shown below. Data are representative of one of two independent experiments (sample from three pooled mice). (E and F) PPT1 down-regulation after DC activation. WT BMDCs were stimulated with poly(I:C) (E) or LPS (F), and Ppt1 transcript was measured at indicated time points by qPCR. Data are combined results of three independent experiments (n = relative values from three independent runs). (G) Phagosomal alkalization after DC activation. WT BMDCs were stimulated with LPS, and then fed with AF488-OVA and pHrodo-OVA. Phagosomal pH was then calculated at indicated time points accordingly. Data are representative of one of two independent experiments (n = 3 mice per group). (H) Crosspriming by DCs with PPT1 overexpression. WT BMDCs were transduced with empty or PPT1-overexpressing retroviruses, then fed with OVA and OT-I cells. Data are representative of one of two independent experiments (n = 3 technical replicates). (I) Costimulatory signals by activated cDC1s in vivo. Ppt1+/+:Batf3−/− or Ppt1−/−:Batf3−/− chimeras were infected with LM-OVA, and then splenic cDC1s (gated on live CD11chi MHC II+ XCR1+ CD172α−) were analyzed at day 5. MFI of CD80, CD86, CD40, and CD24 are shown. Data are representative of one of three independent experiments (n = 3 mice per group). (J) Costimulatory signals by activated cDC1s ex vivo. Splenic cDC1s (gated on live CD11chi MHC II+ XCR1+ CD172α−) were sorted from Ppt1+/+:Batf3−/− or Ppt1−/−:Batf3−/− chimeras and then activated in vitro with LPS for 18 h. MFI of CD80, CD86, CD40, and CD24 are shown. Data are representative of one of three independent experiments (n = 3 mice per group). (K) Costimulatory signals by activated BMDCs in vitro. Surface molecule expression was analyzed on Ppt1+/+ or Ppt1−/− BMDCs from chimeras activated with LPS for 18 h. MFI of CD80, CD86, CD40, and CD24 are shown. Data are representative of one of three independent experiments (n = 3 mice per group). (L) Cytokine production by activated cDC1s. FACS-sorted cDC1s from Ppt1+/+:Batf3−/− or Ppt1−/−:Batf3−/− chimeras were activated with poly(I:C) or LPS for 18 h, then analyzed by FACS intracellular staining. Representative FACS plot of poly(I:C)-stimulated cDC1s (IL-12p40, left), percentages of IL-12p40, and TNF-α production with poly(I:C; right, top) or LPS (right, bottom) are shown. Data are representative of one of three independent experiments (n = 3 mice per group). (M) Cytokine production by activated BMDCs. Ppt1+/+ or Ppt1−/− BMDCs from chimeras were activated with poly(I:C) or LPS for 18 h, then analyzed by intracellular IL-12p40 and TNF-α FACS staining. Data are representative of one of three independent experiments (n = 3 mice per group). (N) Serum IL-12p40 level during T. gondii infection. Ppt1+/+:Batf3−/− or Ppt1−/−:Batf3−/− chimeras were infected with T. gondii, and serum IL-12p40 was measured by ELISA on indicated days. Data are representative of one of two independent experiments (n = 3 mice per group). All data are shown as mean ± SD, and P values were calculated by two-way Student’s t test (*, P < 0.05; **, P < 0.01; ***, P < 0.001).

