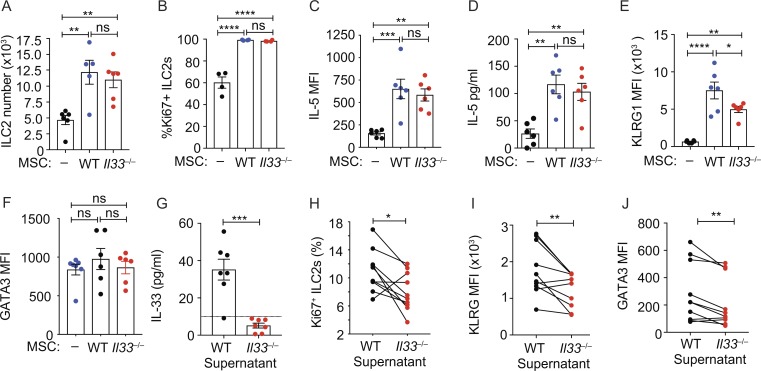
Figure 2.
ILC2s respond to MSC-derived IL-33. (A) ILC2 number at 7 d of culture with WT or IL-33–deficient (Il33−/−) MSCs. Pooled data from three experiments (n = 5 or 6). (B) Frequency of Ki67+ILC2 in co-cultures at day 7. One of two similar experiments (n = 4). (C) Mean fluorescent intensity (MFI) of intracellular IL-5 expression by ILC2s in co-cultures at day 7, determined by flow cytometry. (D) IL-5 in co-culture supernatants at day 7 determined by ELISA. (E and F) MFI of KLRG1 (E) or of intracellular GATA3 expression by ILC2s from co-cultures at day 7 (F). Pooled data are from two experiments (n = 6 mice; C–F). (G) IL-33 in freeze-thawed SVF supernatants analyzed by ELISA. Pooled data from three experiments (n = 7). (H) Frequency of Ki67+ ILC2s cultured for 48 h with supernatants from I. Pooled data represent 10 separate ILC2 purifications from three independent experiments. (I and J) MFI of KLRG1 (I) or GATA3 (J) expression by ILC2s, cultured as in H. Pooled data represent 10 separate ILC2 purifications from three independent experiments. Data are mean ± SEM. ns, not significant; *, P < 0.05; **, P < 0.01; ***, P < 0.001; ****, P < 0.0001; statistical analysis, one-way ANOVA with Tukey’s post hoc test (A–F), Student’s t test (G), or paired Student’s t test (H–J).

