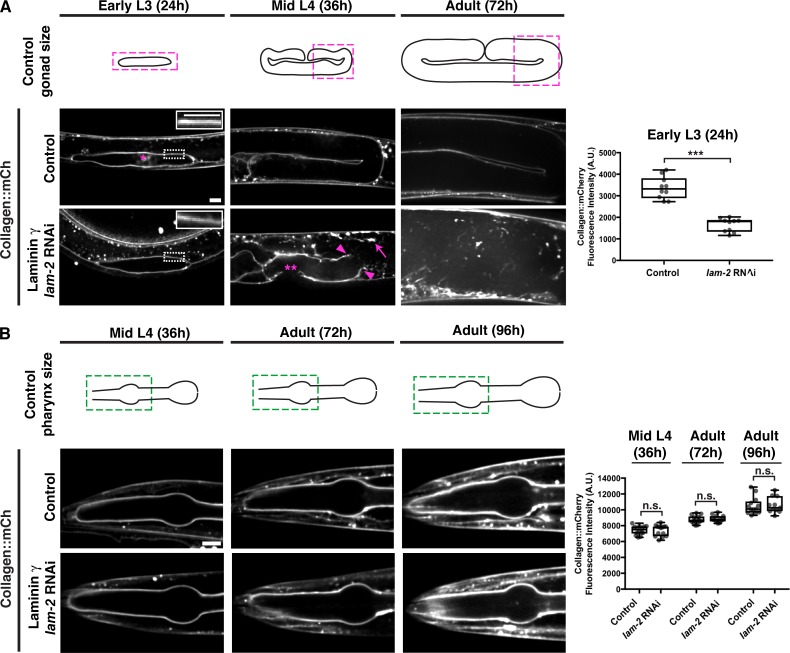
Figure 3.
Collagen recruitment to the gonadal but not pharyngeal BM is dependent on laminin. (A) Fluorescence images of gonadal BM collagen::mCh shown at the early L3, mid-L4, and 72-h adult stages in control and laminin γ (lam-2) RNAi-treated animals (RNAi fed at the L1 stage onwards). Control gonad size at these stages are shown in schematics, and the magenta boxes denote regions of the gonad shown in the figure. Collagen::mCh signal in the dotted box regions are magnified in insets. The asterisk indicates non-BM collagen::mCh signal from coelomocytes. Gonadal BM collagen::mCh fluorescence intensity in control (n = 10) and lam-2 (n = 10) RNAi-treated early L3 animals is quantified on the right. By the mid-L4 stage, rupturing of the gonadal BM (magenta arrowheads) and abnormal collagen aggregation (magenta arrow) was observed in lam-2 RNAi-treated animals (n = 20/20). The double asterisks mark a break in the BM due to anchor cell invasion, a normal morphogenetic event during C. elegans vulval development. (B) Fluorescence images of pharyngeal BM collagen::mCh in control and lam-2 RNAi-treated animals shown at the mid L4, 72-h adult, and 96-h adult stages. Control pharynx size at these stages are shown in schematics, and the green boxes denote regions of the pharynx shown in the figure. Pharyngeal BM collagen::mCh fluorescence intensity in control and lam-2 RNAi-treated animals at all three stages are quantified on the right (mid L4 control, n = 14; lam-2 RNAi, n = 14; 72-h adult control, n = 14; lam-2 RNAi, n = 12; 96-h adult control, n = 13; lam-2 RNAi, n = 11). ***, P < 0.0001, unpaired two-tailed Student’s t test; n.s. (not significant), P > 0.05. Box edges in boxplots depict the 25th and 75th percentiles, the line in the box indicates the median value, and whiskers mark the minimum and maximum values. Scale bars, 10 µm. A.U., arbitrary units.

